 PaisaMaps for business
ObjectiveChoose the next branch locations
With PaisaMapsRank pincodes by spend, banking depth and enterprise density, then check distance to your existing branches.
OutcomeA branch list where each site has a catchment that can carry it.
For NBFCs: gold loan, MSME, microfinance, vehicle and consumer finance
An NBFC grows branch by branch, and every branch has to earn its cost from the pincodes around it. PaisaMaps ranks those pincodes by household income and spend, banking depth and local enterprise, so the next branch, agent or campaign goes where the demand is.
One map, five kinds of lender
Each kind of NBFC leans on a different mix of signals. Pick yours.
Gold loans
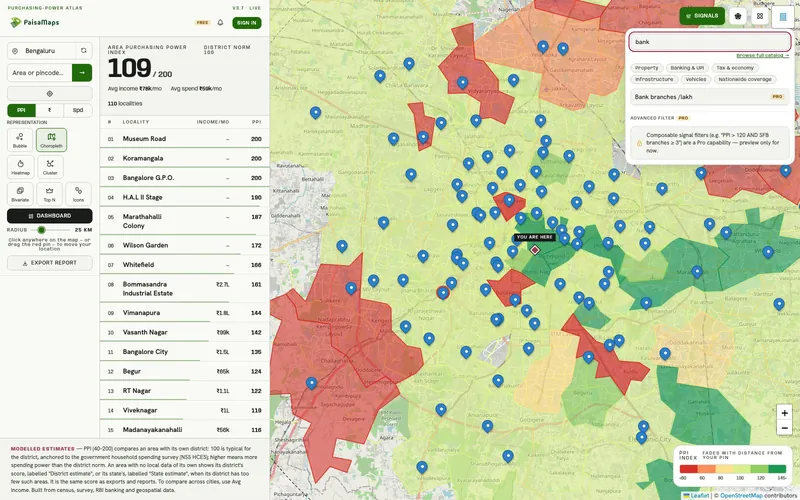
Gold-loan branches compete on reach. Read household spend against bank branches per lakh people to find areas with spending power and few branches nearby.
MSME lending
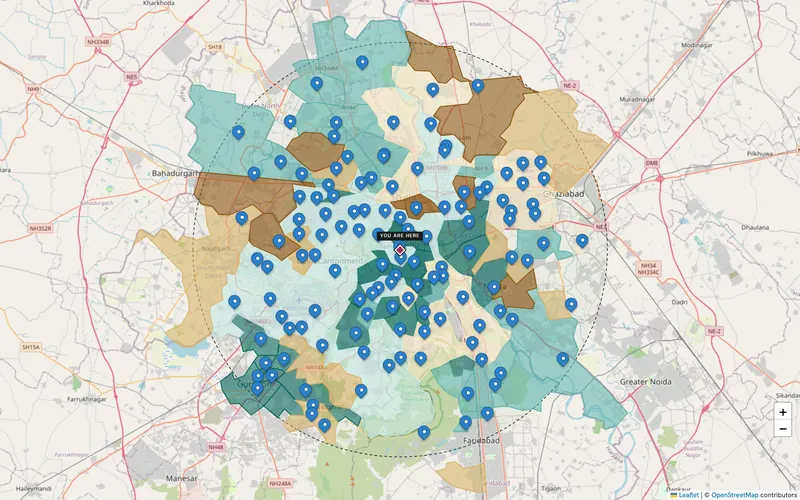
MSME registrations per lakh people show where small enterprise clusters, district by district. Pair it with household spend to find trading towns worth a branch.
Microfinance
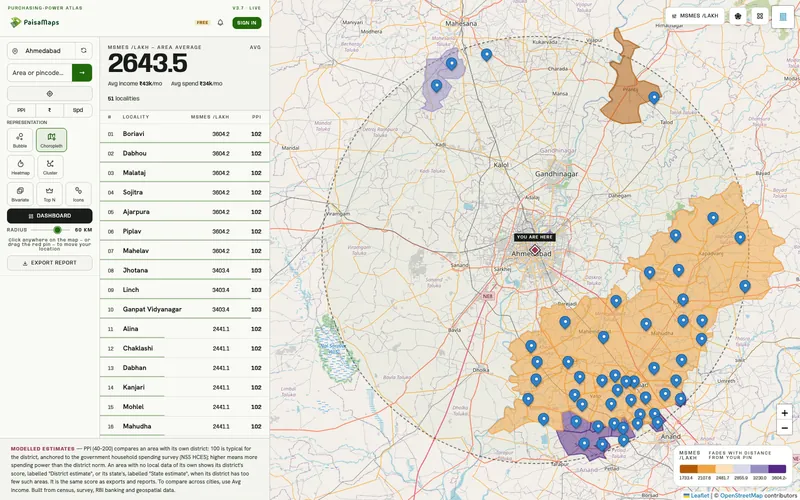
Read cropping intensity, enterprise density and banking depth together. Most rural pincodes carry a district estimate, and the map labels them, so rank districts and blocks rather than villages.
Vehicle finance
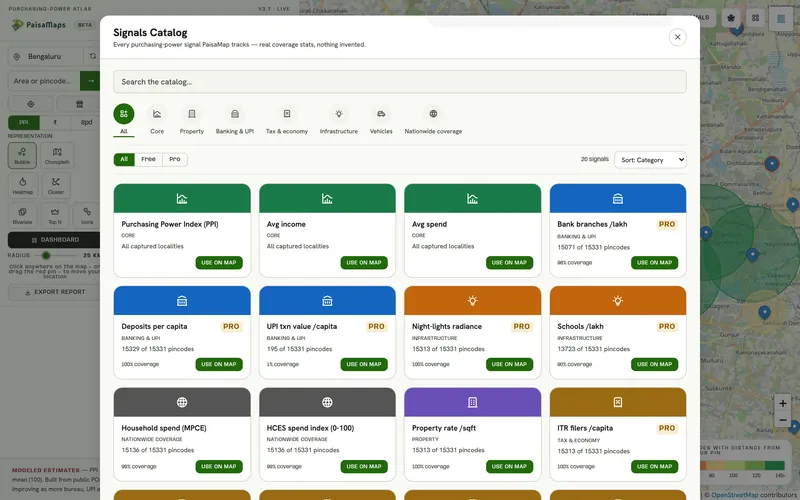
The car-to-two-wheeler mix and car ownership show where an area is still two-wheeler-led, and income shows whether it can afford the step up.
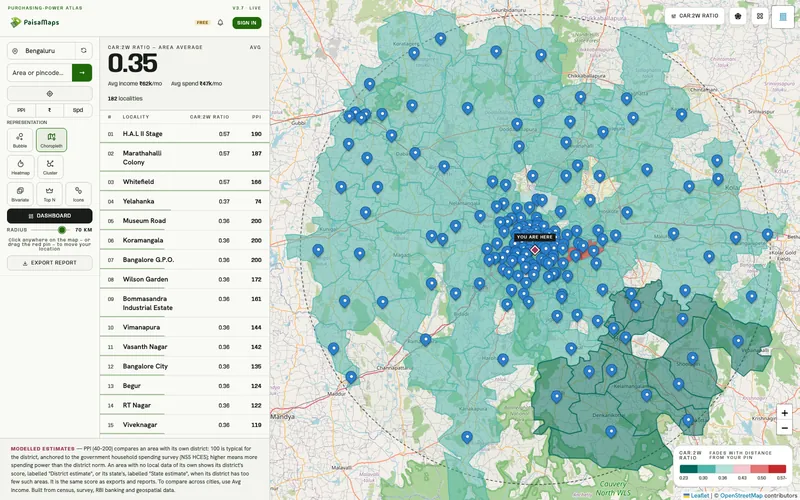
Personal & consumer-durable loans
Purchasing power and household spend size the market for small-ticket personal and consumer-durable loans, and show where dealer and retailer tie-ups will see the most demand.
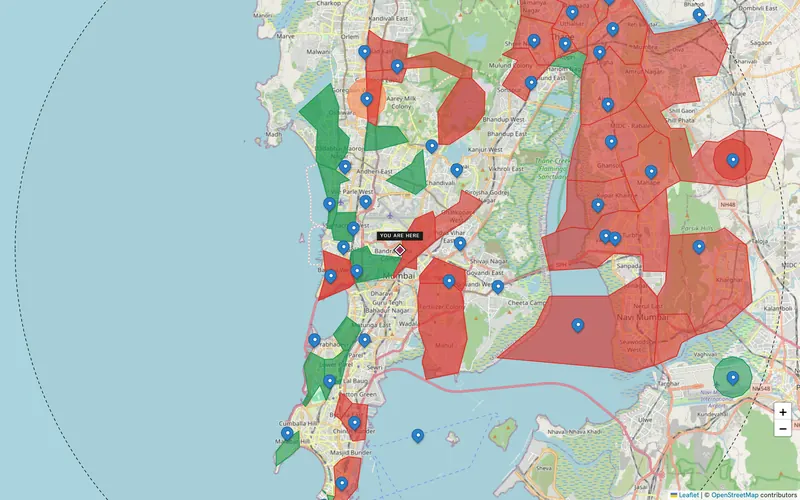
What you can achieve
ObjectiveChoose the next branch locations
With PaisaMapsRank pincodes by spend, banking depth and enterprise density, then check distance to your existing branches.
OutcomeA branch list where each site has a catchment that can carry it.
ObjectivePhase a new-state entry
With PaisaMapsExport every scored pincode in the state with its signals and level, and rank them in your own model.
OutcomeA year-one and year-two plan, with the reasons written down.
ObjectivePoint sourcing and DSA effort
With PaisaMapsRead your branches against the strength of their areas, and spread field teams by market size.
OutcomeSourcing effort that follows the market, not the org chart.
ObjectiveAdd an area feature to your models
With PaisaMapsPull signals by pincode with an API key and join them to your book.
OutcomeA documented area input next to bureau and customer data, reviewed under your own governance.
In the workspace
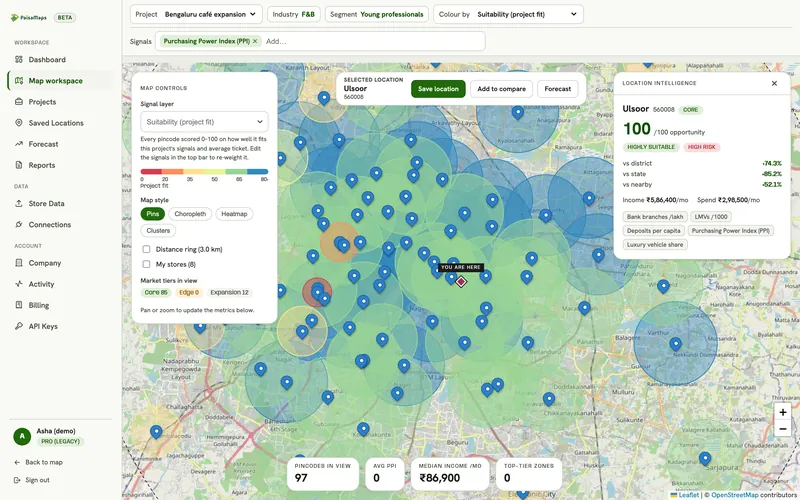
Click a pincode: its opportunity score, how it compares with its district and state, and the signals behind it.
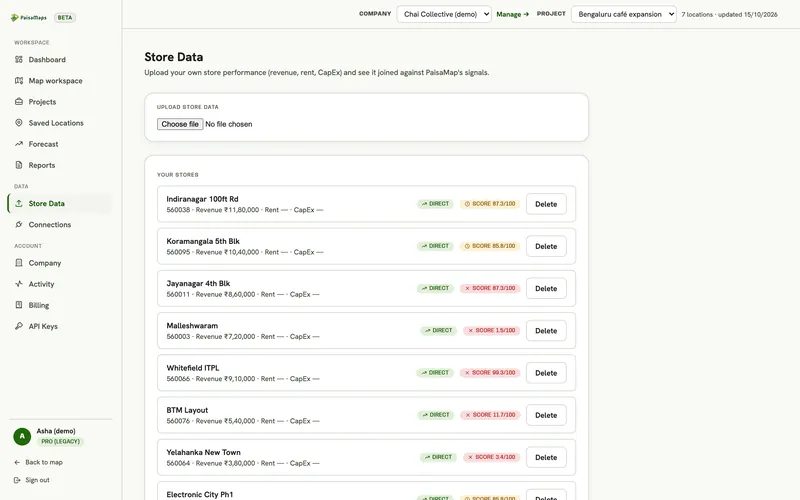
Upload branches with a performance figure. Each is scored against its area, and the profile of your best branches surfaces.
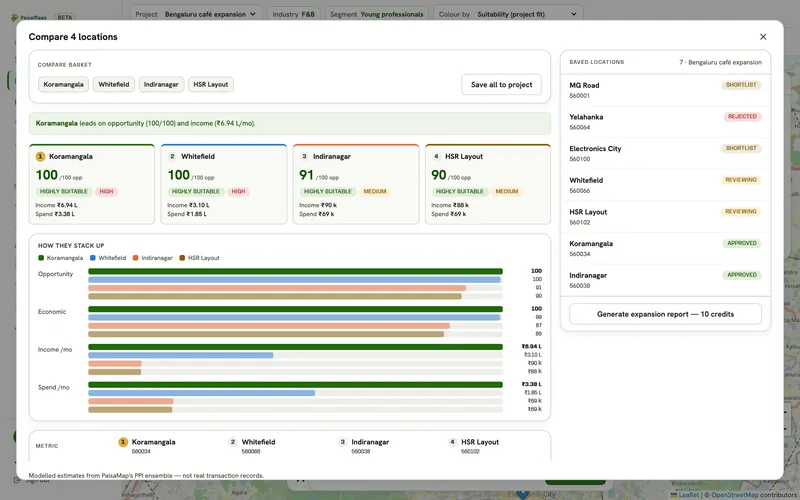
Line up to five candidates on opportunity, income, spend and risk.
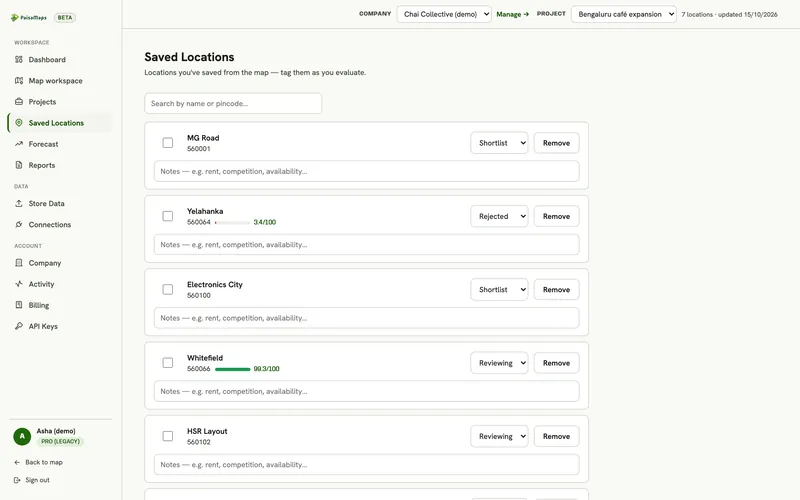
Every candidate carries a status and notes, so the expansion committee sees one list.
Use it the right way
A business case, start to finish
Twenty branch locations in two phases, each with its catchment and ranking saved to the project for the credit and expansion committees.
Who's involved
Uses it every week
Ranks pincodes, uploads branch performance, compares candidate locations and exports area signals.
What they getA branch shortlist with reasons, and area features ready to join to the book.
Reads and decides
Approves which states, districts and branch sites come next, and which area features enter the model.
What they getOne document per expansion decision, with every signal's source and level.
Pays for it
Owns the expansion, analytics or data budget.
What they getBranches opened where the book can grow, and fewer that never break even.
Before you buy
No. It's an area-level signal, the same for everyone in a pincode. Use it for where to grow, alongside your own customer-level data and credit policy.
Most rural pincodes don't have data of their own yet, so they carry a district or state estimate, labelled as one. Use it to rank districts and blocks; don't read differences between two villages into it.
Yes. Upload a CSV or Excel file with branch, pincode and a performance figure such as monthly disbursement. Each branch is scored against its area, and the file stays in your company, encrypted.
RBI branch and deposit statistics, and PhonePe Pulse for UPI value, all at district level. The signals page lists each source and level.
Keep exploring
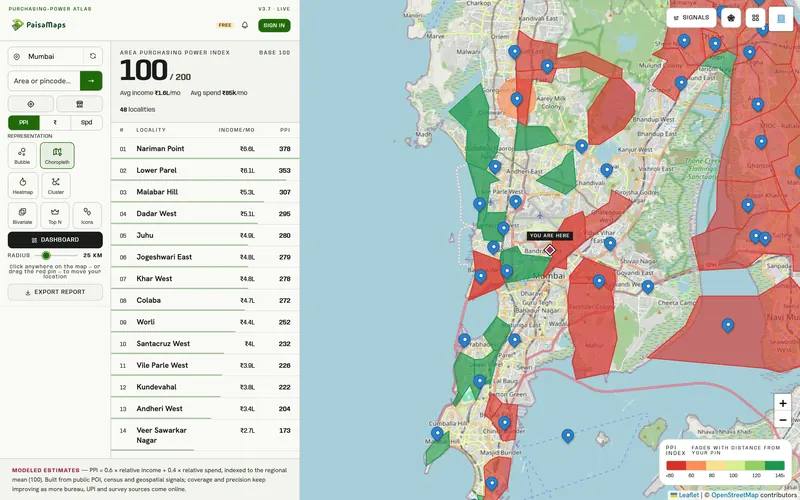
Shortlist candidate pincodes by purchasing power, check each catchment, compare up to five sites side by side and send a…
Explore →Use pincode income, spend and banking depth to prioritise sourcing and size products by region, joined to your own data on…
Explore →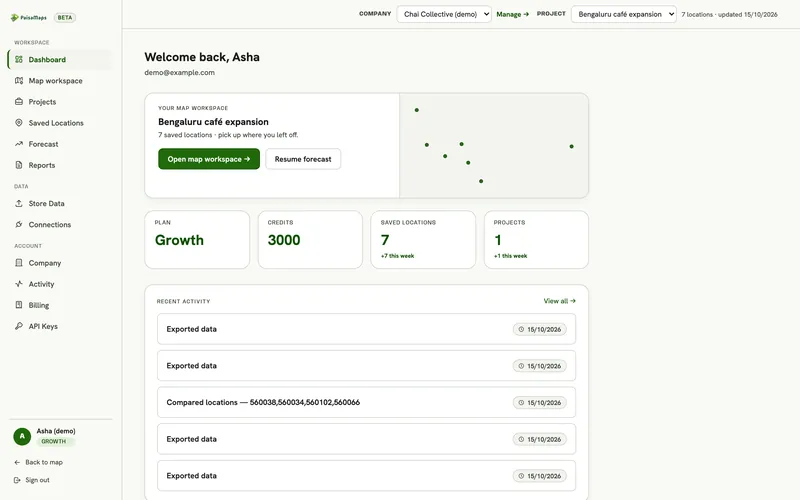
A shared workspace for expansion decisions: projects, location intelligence, site comparison, saved-location pipeline, your…
Explore →We'll rank its pincodes with you on income, spend and banking depth, in about 20 minutes.