PaisaMaps for business
Product Platform overviewMap, signals, workspace and API in one tourLive mapSpending power for every pincode, six ways to see itWorkspaceProjects, store data, compare, reportsSignals & dataWhat we capture, from where, how oftenExpansion forecastFrom a budget to ranked sites and revenue rangesData API & exportsCSV, Excel, JSON and API keys
Solutions Retail & F&BWhere to open the next storeReal estate & hotelsCatchment demand for projects and propertiesLenders, NBFC & fintechArea-level affordability and market sizeAny businessD2C, franchises, services, SMEsAgencies & consultantsStrategy firms working for many clientsSite selectionRank candidate pincodesMarket sizingHouseholds × spend for any areaCatchment analysisWho lives around a siteCredit & affordabilityAn area input for lendingTerritory planningBalance sales territoriesPortfolio benchmarkingScore the stores you already have
Pricing
Resources How it worksBefore and after you sign inWhy PaisaMapsWhat's different, honestly comparedMethodologyHow every score is built, checked and labelledSecurityHow your account and data are protectedFAQProduct, data, pricing, securityHelp & supportGet an answer from a person
Open the mapTalk to us

Signal capturing

Eighteen signals that explain who can spend, each one traceable.

We collect public data on banking, tax, vehicles, satellite night-lights, digital payments and more, join it to each pincode, and combine it into purchasing power, income and spend.

15,341
pincodes with the core metrics
769
with data of their own
18
signals, each with a source
District
level of the official spending anchor

How to read it

Most signals are published for a district or a state, not a pincode. We say which, and a district figure never pretends to tell two pincodes apart.
Signal levels are shown on every card below

The palette

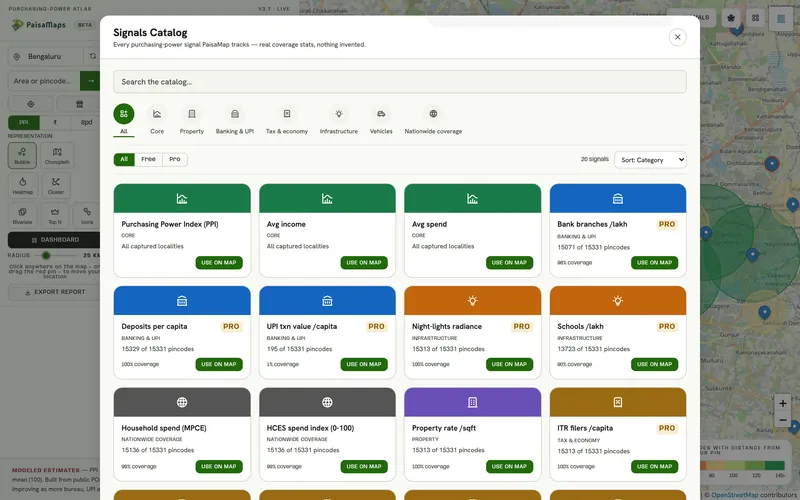
Every signal, what it measures, its source and level

The level tells you how fine-grained a signal is. Pincode-level signals vary street to street; state-level ones set the wider context.

Core on the free map Lite ₹200 signal plan and up Pro ₹500 signal plan, every dashboard plan

Purchasing power

3 signals
  • Purchasing Power IndexCore

    One number for an area's spending power, 100 = the district norm.

    Pincode · modelledBuilt from every signal below
  • Household income / monthCore

    Estimated monthly income of a typical household in the pincode.

    Pincode · modelledNSSO HCES, calibrated with state and district data
  • Household spend / monthCore

    Estimated monthly consumption spend of a typical household.

    Pincode · modelledNSSO HCES household spending survey
Banking & UPI

3 signals
  • Bank branches / lakh peopleLite

    How well served an area is by formal banking.

    DistrictRBI branch statistics
  • Bank deposits per personLite

    Savings held in banks, a proxy for accumulated wealth.

    DistrictRBI BSR deposits
  • UPI value per personLite

    How much people pay digitally, a live signal of everyday spending.

    DistrictPhonePe Pulse

Tax & economy

5 signals
  • Income-tax filers per personPro

    Share of people filing returns, a direct marker of formal income.

    StateCBDT annual report
  • MSMEs / lakh peopleLite

    Density of small businesses, a read on local enterprise.

    DistrictMSME Udyam registrations
  • Factories / lakh peoplePro

    Industrial employment base.

    StateASI factory counts
  • State output per personLite

    Net state domestic product per head, the wider economy around the area.

    StateState NSDP statistics
  • Cropping intensityPro

    How intensively farmland is used, useful for rural markets.

    StateMoSPI statistical year book

Infrastructure

2 signals
  • Night-light brightnessLite

    Satellite-measured light at night, a strong proxy for economic activity.

    PincodeNASA VIIRS
  • Schools / lakh peoplePro

    Social infrastructure and family density.

    DistrictUDISE+

Vehicles

4 signals
  • Cars / 1,000 peopleLite

    Car ownership, one of the clearest affluence signals.

    DistrictVAHAN registrations
  • Car to two-wheeler ratioLite

    How far an area has moved up from two-wheelers.

    DistrictVAHAN registrations
  • Luxury vehicle shareLite

    Share of premium vehicles among registrations.

    DistrictVAHAN registrations
  • EV sharePro

    Early-adopter and premium-buyer signal.

    DistrictVAHAN registrations

Property

1 signal
  • Property rate / sq ftPro

    Indicative price of property. A city-level estimate, not transaction data.

    City-level estimatePaisaMaps estimate

Signals measured at district or state level are the same for every pincode inside that area. The purchasing-power model combines them with pincode-level ones; it doesn't pretend they are pincode measurements.

How a score is built

From public data to a pincode score

Collect

Pull each source in its published form, keep its licence terms, and record when it was fetched.

Join

Attach each value to pincodes using India Post's PIN boundaries and directory.

Model

Combine the signals into purchasing power, then estimate income and spend, calibrated to the national household survey.

Check

A weekly refit must pass fixed sanity gates (for example, known affluent areas must outrank their neighbours) before anything changes.

Sources

Where the signals come from

SurveyNSSO HCES household spendingBankingRBI branches & depositsTaxCBDT income-tax filersSatelliteNASA VIIRS night-lightsPaymentsPhonePe Pulse UPI valueVehiclesVAHAN registrations: cars, EVs, luxuryBusinessMSME Udyam registrationsIndustryASI factory countsEducationUDISE+ schoolsEconomyState NSDP per capitaBoundariesIndia Post PIN polygonsIncomeKarnataka DES district income

We don't sell OpenStreetMap-derived data, and we don't claim real-time, transaction-level or footfall data.

Signals that matter here

From signal to decision

Every plan sees purchasing power, income and spend. These are the signal groups that move this decision.

Signal groupWhat it tells youThe decision it feeds
Purchasing powerHow much a typical household earns and spends, and how that ranks in its stateWhere your price point has enough customers; which sites to shortlist
Banking & UPIHow banked and how digitally active an area isWhere credit, payments or premium products will be adopted first
Tax & economyHow many people file income tax, and the local business baseFormal-income depth for lending; B2B and SME demand
InfrastructureNight-time activity and schooling, as a read on how developed an area isWhether a catchment is established or still emerging
VehiclesCar ownership, the car-to-two-wheeler mix, luxury and EV sharePremium vs value positioning; parking-led formats; mobility products
PropertyA city-level estimate of property ratesRent and capex context for a city (not a valuation)

Each signal's source and level (pincode, district or state) is listed on the signals page.

FAQ

About the data

More detail on the methodology page.

Are these real incomes?

No. They are modelled estimates built from public data. They are good for comparing areas, not for judging a single household.

How often does it change?

The model is refitted weekly. Each source updates on its own schedule; some publish yearly.

Can I add my own data?

Yes. Upload your store list with revenue in the workspace. It stays in your account, encrypted, and is used to score your stores and calibrate your forecast.

Which signals come with which plan?

The three core metrics and the property-rate estimate are free. Signals Lite adds 9 signals for ₹200 a month, and Signals Pro or any dashboard plan includes all of them.

See your own market on the map

Tell us the cities and the decision you're making. We'll walk through it with you on the real data in about 20 minutes.