 PaisaMaps for business
Methodology
How a score is built, checked and labelled.
Every number on the map comes from a public source or from a model fitted to them, and says which. Here is the whole chain, including what we don't know.
- 15,341
- pincodes scored
- 769
- with data of their own
- District
- level of the spending anchor
- Weekly
- refit, gated
The chain
Six steps from public data to the map
Each step is automated and re-run on a schedule; none is edited by hand.
Collect
Pull each source in its published form (RBI banking, income-tax filers, vehicle registrations, satellite night-lights, UPI value and more), keep its licence terms and record when it was fetched.
Place
Attach every value to a pincode using India Post's PIN boundaries and directory. A pincode's name is its own India Post office name, and its point sits inside its own boundary.
Anchor
Tie household spending to the national survey: Household Consumption Expenditure Survey 2023-24 figures at district level, from a compilation of MoSPI's unit-level data (under review: MoSPI publishes official figures only by state). 100 on the purchasing-power index is the district norm.
Model
Three models (a regression on the combined signals, a gradient-boosted model and a spatial smoother) are blended into purchasing power; income and spend follow from the anchor.
Estimate gaps honestly
A pincode with no data of its own takes its district's typical score and is labelled "District estimate". We don't invent differences we can't measure.
Check before publishing
The weekly refit must keep fixed orderings (for example Golf Links above Saket in Delhi) and may not swing pincodes by more than 10 points without a dated, approved review. Data sanity checks run every night.
Coverage, plainly
What rests on data, and what is estimated
- 15,341
- pincodes scored80% of India Post's 19,097
- 769
- have data of their ownabout 5% of scored pincodes
- Labelled
- every other scoreas a district estimate
Counts are read from the data each time this site is built.
Reading the map
The labels you'll see
- Own data
- The pincode has at least one measured value of its own; its score can differ from its neighbours'.
- District estimate
- No data of its own: the typical score of its district. Two such pincodes in a district are deliberately equal.
- City-level estimate
- Property rate. Indicative for the city, not a valuation or transaction price.
- —
- No value. We show a blank rather than fill a gap.
Our rules
What we always do, and never do
Always
- Say where a number comes from and at what level
- Show an estimate as an estimate
- Report a failed check rather than work around it
- Quote coverage as measured pincodes next to the total
Never
- Invent places, numbers or sample data to fill a gap
- Let a district or state figure separate two pincodes
- Loosen or swap a check to get a refit through
- Claim footfall, transaction or real-time data
FAQ
Methodology questions
Are these real incomes?
No. They are modelled estimates of a typical household, good for comparing areas, not for judging any one household.
Why do neighbouring pincodes sometimes show the same score?
Because neither has data of its own, so both take their district's estimate. Showing a difference we can't measure would be invented precision.
Why did a score change?
The model is refitted weekly as sources update. Large changes are only allowed through a dated, reviewed approval.
Can we see the sources?
Yes. The Signals & data page lists every signal with its source and level.
Keep exploring
Where to go next
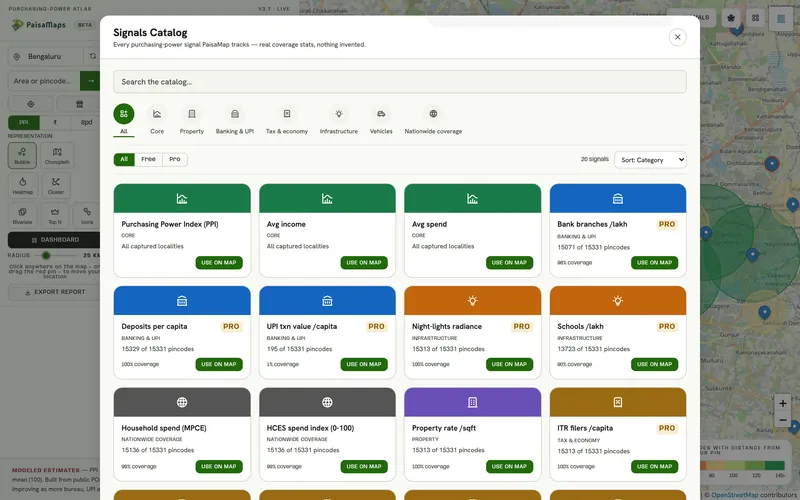
Signals & data
Pincode-level economic data for India: purchasing power, income, spend and 15 signals across banking, tax, infrastructure…
Explore →
Security
Google sign-in with no passwords, store data encrypted at rest and scoped to your company, hashed API keys, payments through…
Read more →FAQ
Answers about PaisaMaps' data, signals, map, workspace, pricing, security and accounts.
Read more →Want to check a score with us?
Send us a pincode and the decision behind it; we'll show you exactly what the score rests on.