 PaisaMaps for business
ObjectiveWhich neighbourhoods in this city are the most affluent?
With PaisaMapsColour by purchasing power; read the ranked list beside the map.
OutcomeA first long list, free.
Live map
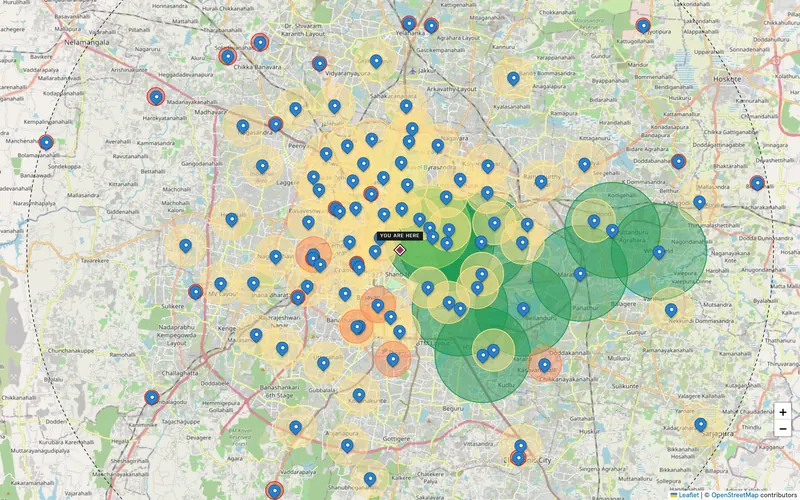
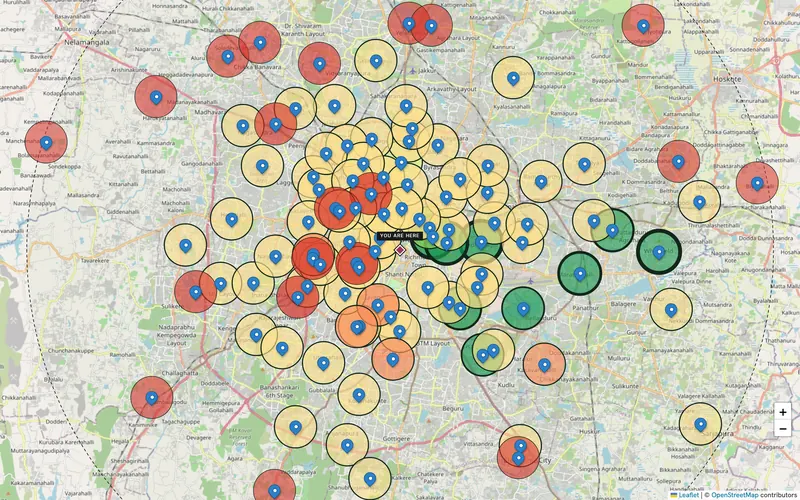
15,341 pincodes, coloured by purchasing power, household income or spend. Free to use, no sign-in.
Six views
The same data, drawn differently. Swipe or use the arrows.
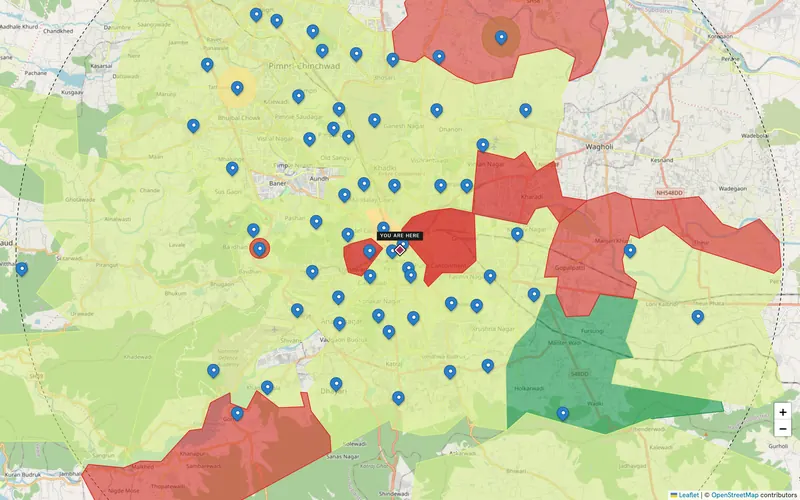
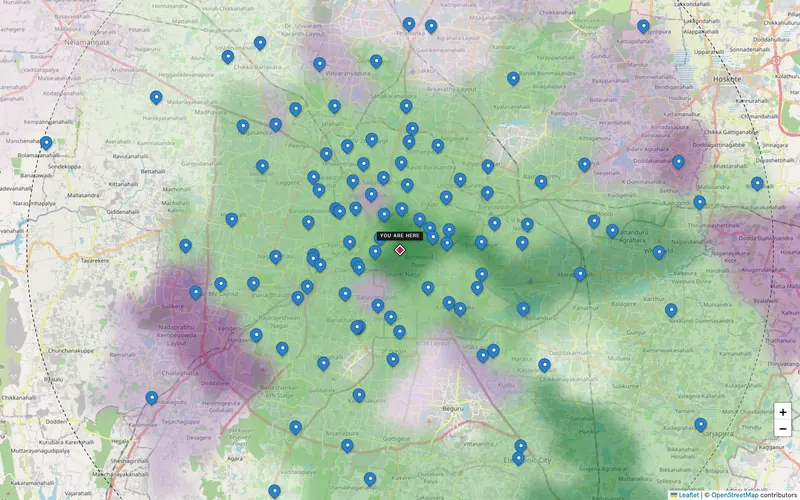
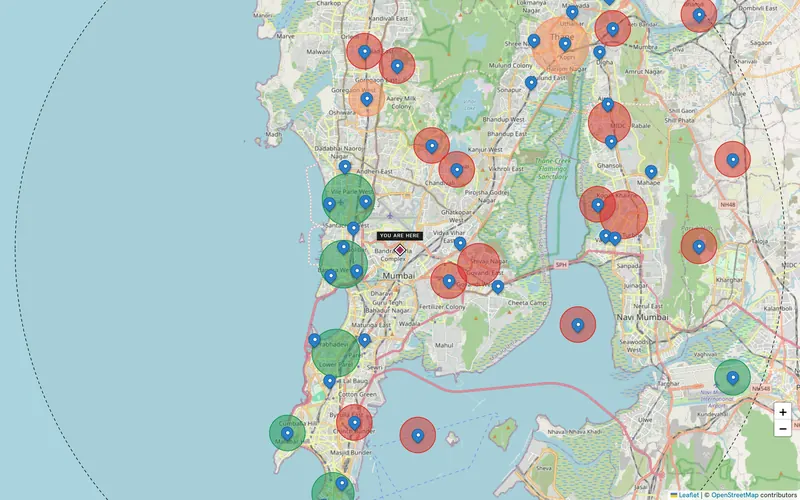
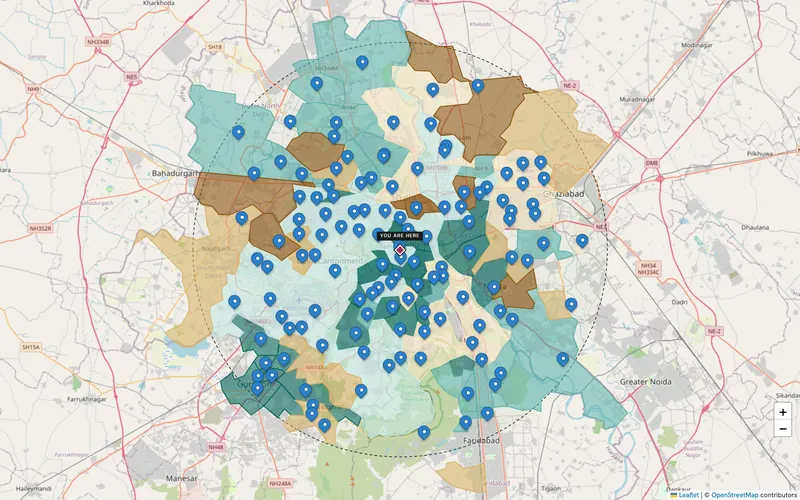
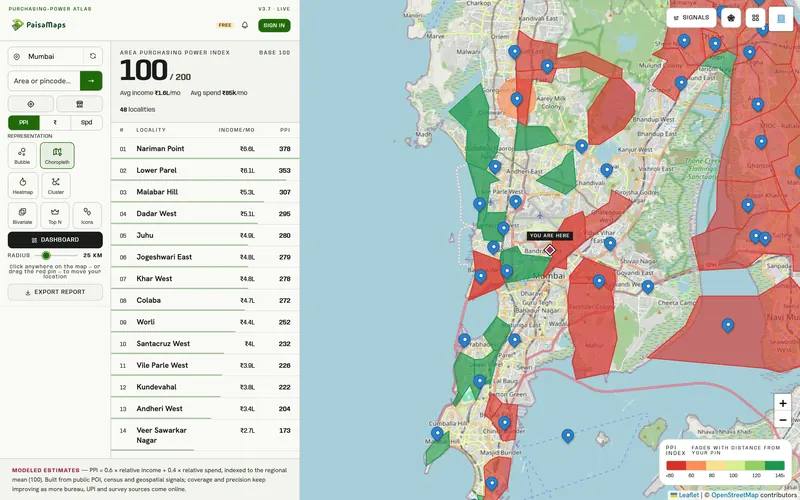
Switch the metric
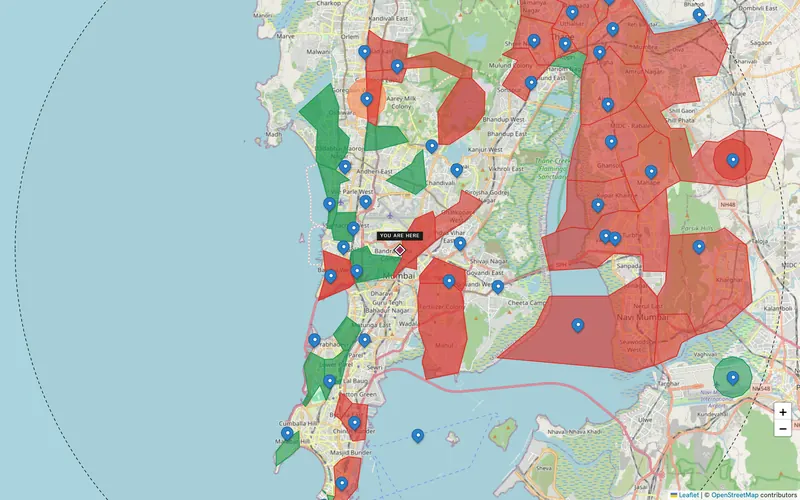
Drag across Mumbai. Purchasing power blends income and spend, ranked against the region.
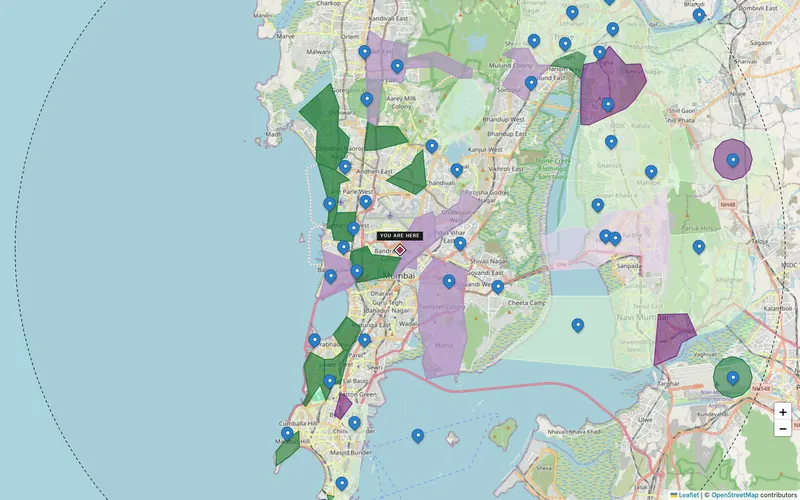
On every pincode
Click any pincode on the free map.
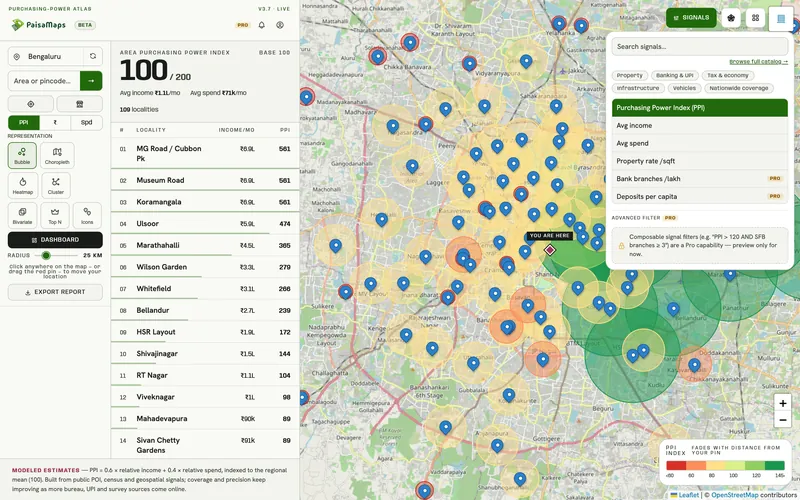
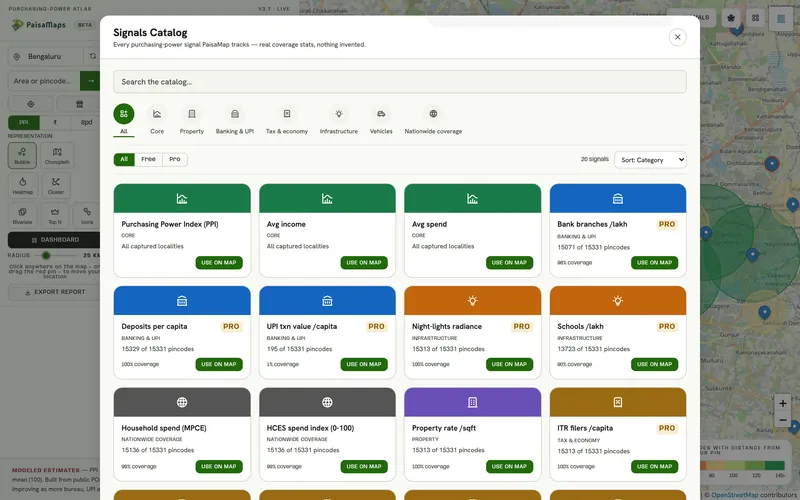
Signal explorer
Find a signal by name and paint the map with it: car ownership, UPI use or tax filers show who is behind the spending.
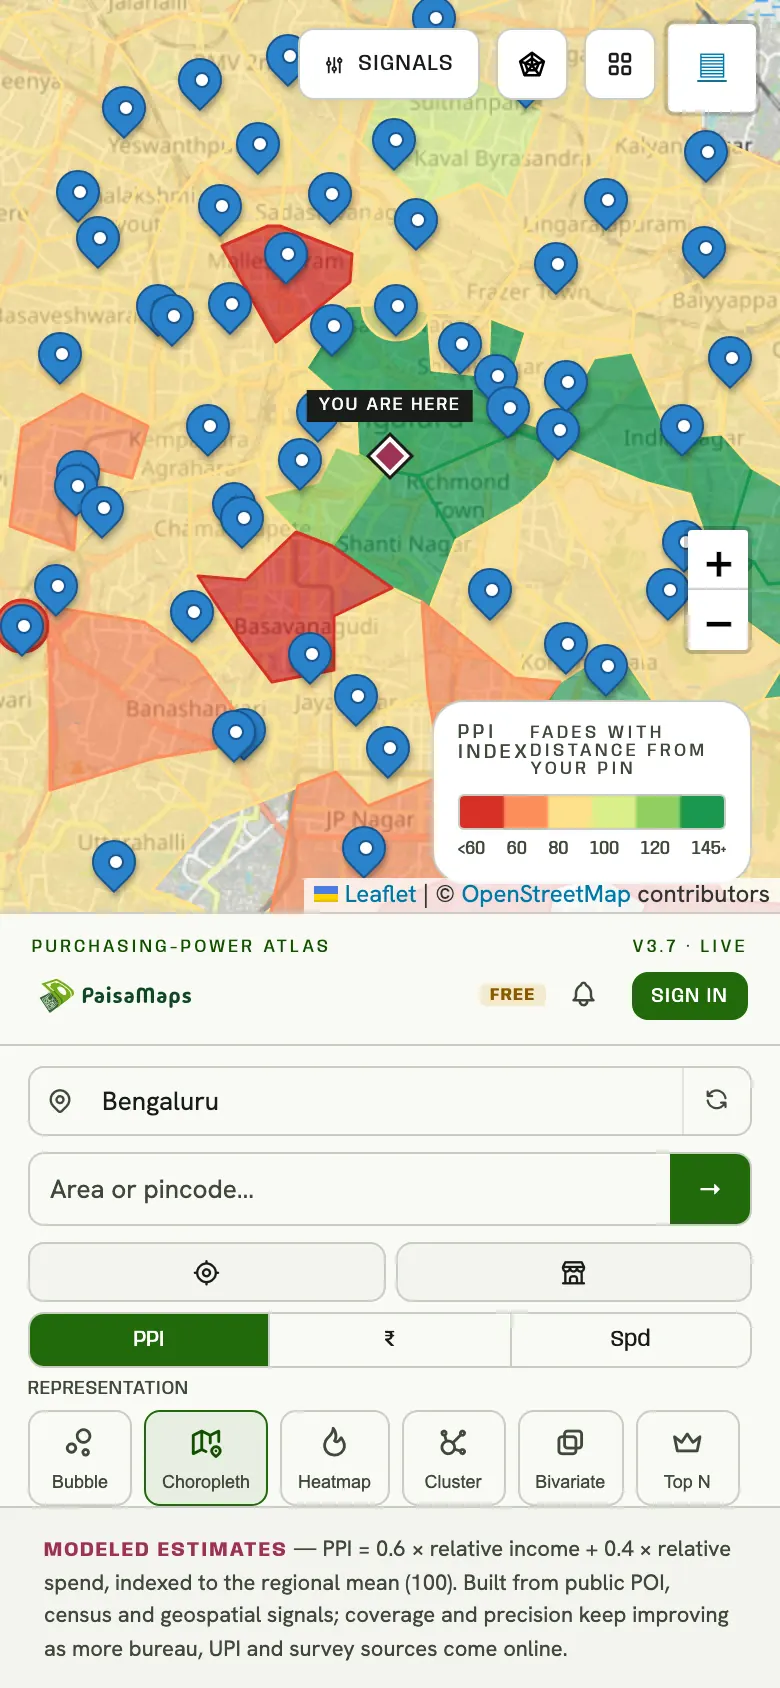
On your phone
The map works on a phone, so you can check an area while you're standing in it.
In the first five minutes
ObjectiveWhich neighbourhoods in this city are the most affluent?
With PaisaMapsColour by purchasing power; read the ranked list beside the map.
OutcomeA first long list, free.
ObjectiveWhere does income concentrate?
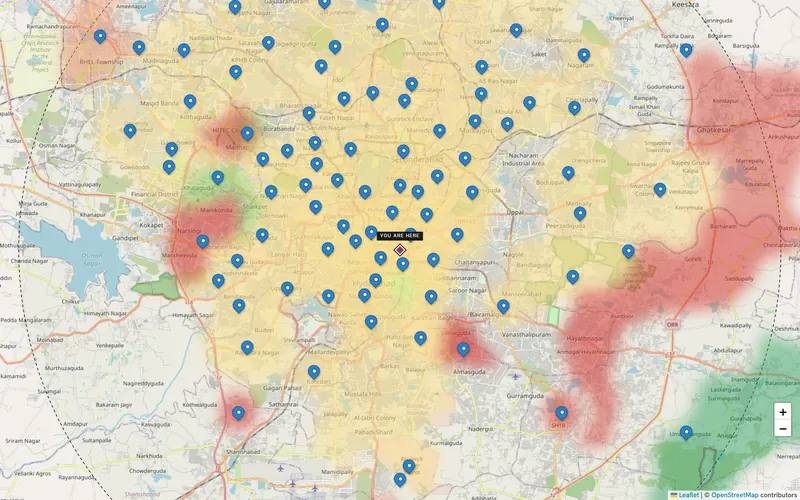
With PaisaMapsSwitch to the income heatmap.
OutcomeWhere premium formats and products belong.
ObjectiveIs this pincode above or below its area?
With PaisaMapsClick it for its numbers and how it compares.
OutcomeA quick sense-check before a site visit.
FAQ
Yes. Anyone can open it, search and read purchasing power, income and spend without signing in.
We draw India Post's own PIN boundaries. Where a pincode has no published boundary, it keeps a circle rather than borrowing a neighbour's shape.
Purchasing power is indexed so the district norm is 100. 130 means about 30% above it; 70 means about 30% below.
Keep exploring
Pincode-level economic data for India: purchasing power, income, spend and 15 signals across banking, tax, infrastructure…
Explore →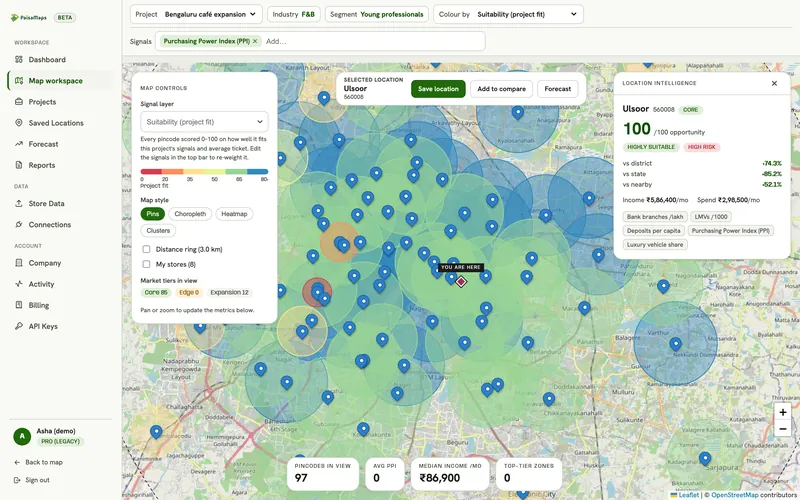
Draw a ring around a site and read the purchasing power, income, spend and signals of every pincode inside it, compared with…
Explore →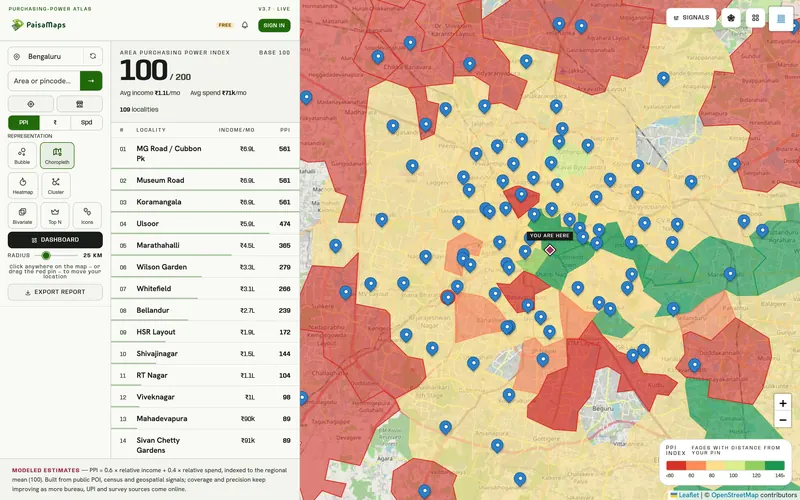
Retail, café, QSR and pharmacy chains use PaisaMaps to find pincodes that can support their ticket size, compare candidate…
Explore →Tell us the cities and the decision you're making. We'll walk through it with you on the real data in about 20 minutes.