 PaisaMaps for business
Use case · Catchment analysis
Know who lives around a site.
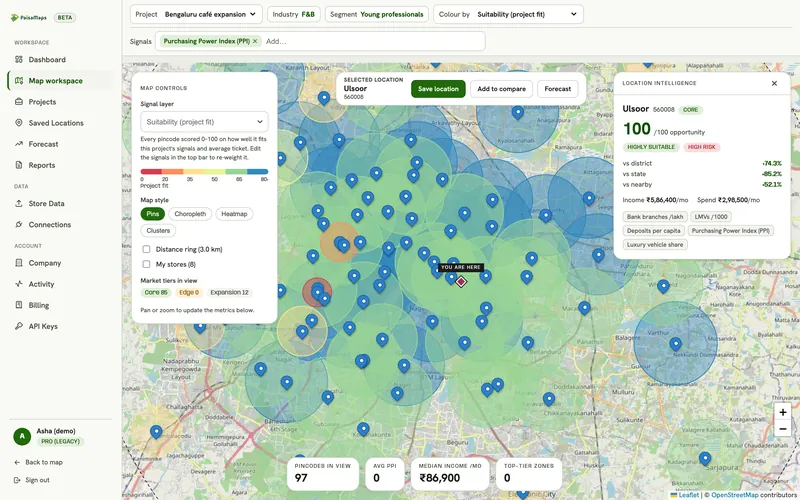
Read a site's catchment in minutes: the households inside the ring, what they can spend, and how it compares with the areas around your best stores.
Why it matters
Two sites a few kilometres apart can have very different customers. The catchment, not the address, decides how a site performs.
Worked example
Is this mall unit worth the rent?
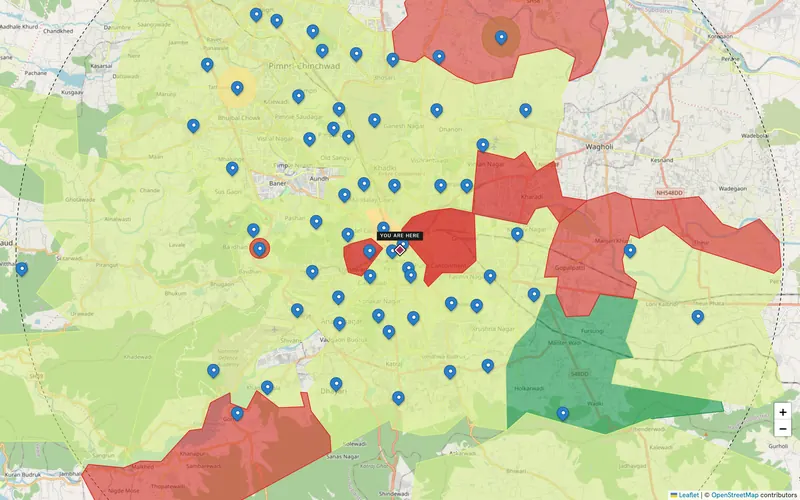
- Ring the mallRead the pincodes within a short drive.
- Profile itIncome, spend, car ownership and UPI use inside the ring.
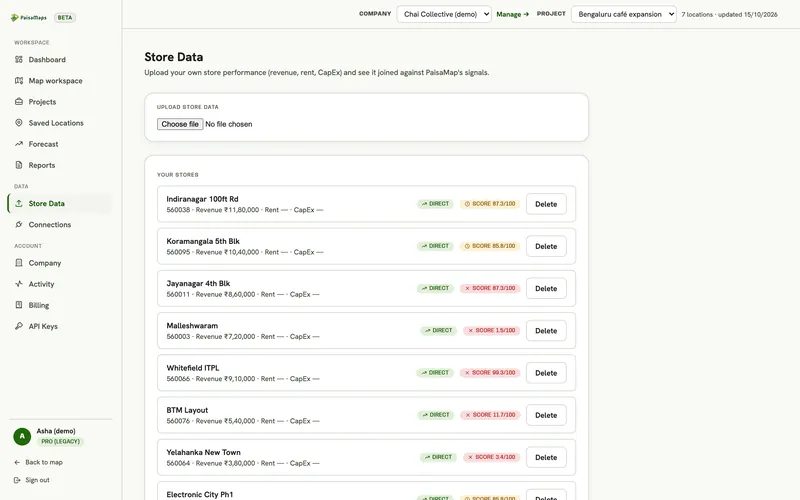
- BenchmarkThe same profile around the brand's top five stores.
- CompareWhere the mall's catchment is stronger or weaker.
The decision
The brand negotiates the rent with the catchment comparison in hand, rather than on the mall's own footfall claims.
What the team walks away with
- A catchment profile
- A benchmark against your best stores
- A report for the negotiation
How it's done
Reading a catchment
Pick the site
Click a pincode or drop a pin.
Set the radius
A ring at the distance your customers travel.
Read inside the ring
Opportunity, income, spend and the signals of each pincode inside.
Benchmark
Against your best stores' catchments.
By industry
How each industry uses it
| Industry | What they do with it |
|---|---|
| Retail & F&B → | Checks a site's catchment against those of the brand's best stores. |
| Real estate & hotels → | Reads the households around a project to set unit mix, pricing or tenant mix. |
| Any business → | Draws delivery or service zones around demand. |
Signals that matter here
Which signal answers which question
Every plan sees purchasing power, income and spend. These are the signal groups that move this decision.
| Signal group | What it tells you | The decision it feeds |
|---|---|---|
| Purchasing power | How much a typical household earns and spends, and how that ranks in its state | Where your price point has enough customers; which sites to shortlist |
| Vehicles | Car ownership, the car-to-two-wheeler mix, luxury and EV share | Premium vs value positioning; parking-led formats; mobility products |
| Infrastructure | Night-time activity and schooling, as a read on how developed an area is | Whether a catchment is established or still emerging |
Each signal's source and level (pincode, district or state) is listed on the signals page.
What you walk away with
A catchment you can compare
You get
- Every pincode inside the ring, scored
- Income, spend and signals together
- A benchmark against your own stores
You don't need
- Footfall counters
- A drive-time study
- Paid panel data
Keep exploring
Where to go next
Retail & F&B
Retail, café, QSR and pharmacy chains use PaisaMaps to find pincodes that can support their ticket size, compare candidate…
Explore →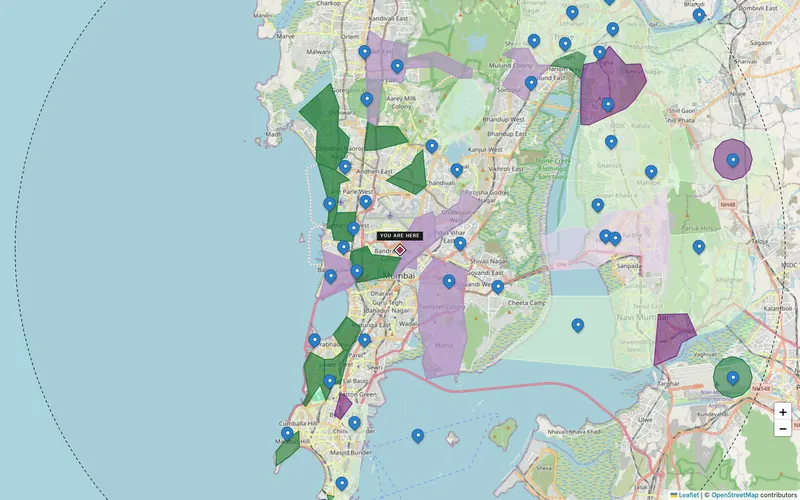
Real estate & hotels
Developers, mall operators, leasing teams and hotel chains read the spending power around a project by pincode, compare…
Explore →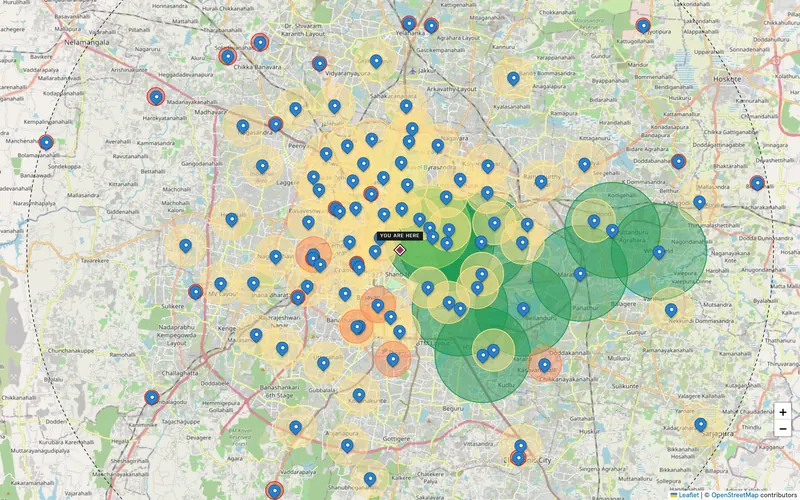
Live map
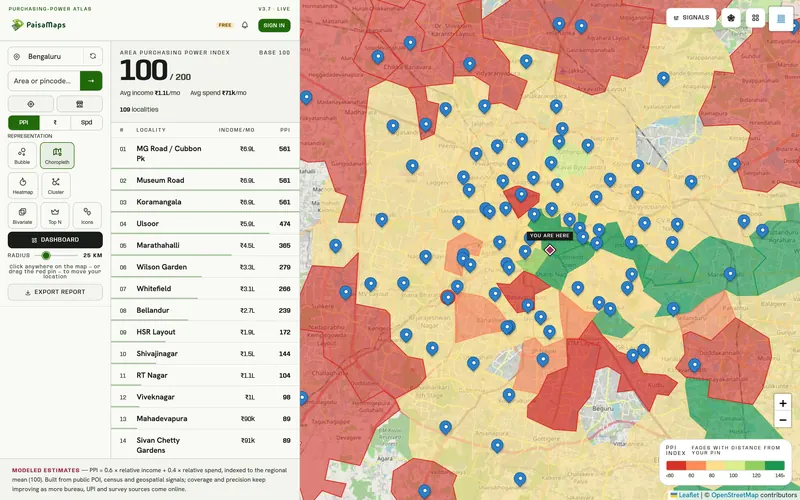
Search any Indian city or pincode and see purchasing power, income and spend as a choropleth, heatmap, bubbles, clusters…
Explore →