 PaisaMaps for business
Use case · Market sizing
Size a market in households and rupees.
Replace a top-down guess with a bottom-up estimate: households and spend, pincode by pincode, for exactly the area you mean.
Why it matters
A market-size number decides budgets, hiring and targets. Built bottom-up from pincodes, it can be checked, split and defended.
How it's done
From an area to a number you can defend
Choose the area
A city, a radius around a point, or a whole state.
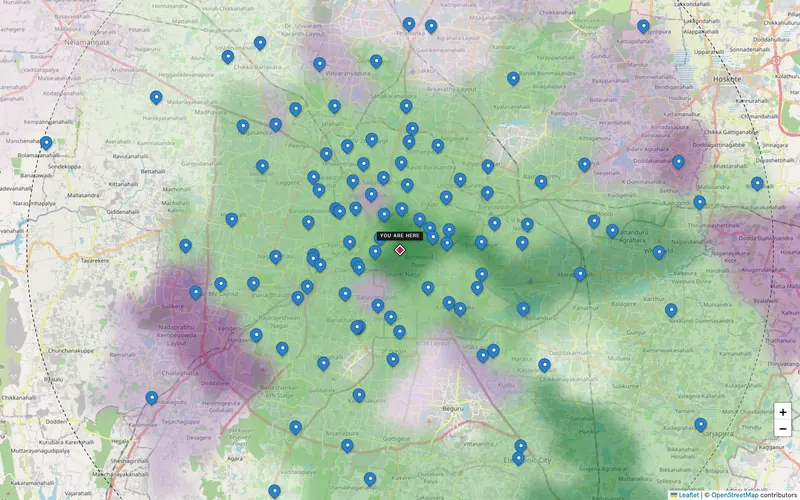
Pick the measure
Households, income, spend or purchasing power.
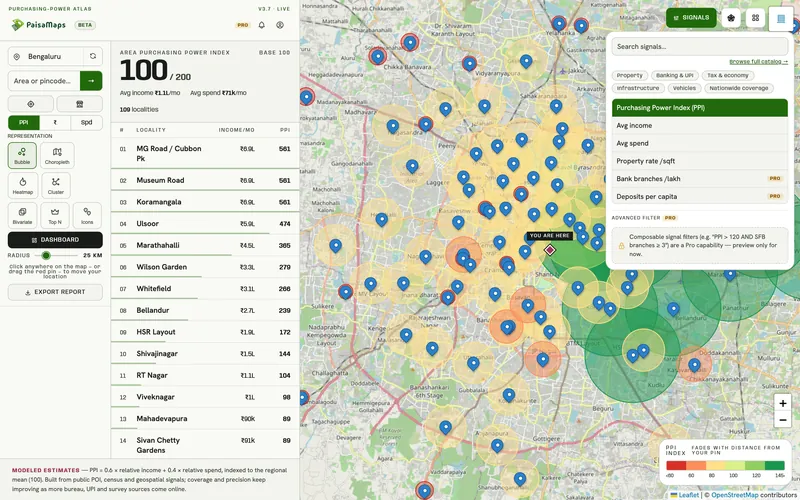
Segment it
Split by signal, for example car ownership or UPI use.
Export
Download by pincode as CSV, Excel or JSON for your model.
Worked example
Sizing a premium grocery format in one metro
- Export the metroAll scored pincodes with households, income and spend.
- FilterKeep pincodes in the top band of purchasing power with high car ownership.
- SumHouseholds and monthly spend in the filtered set.
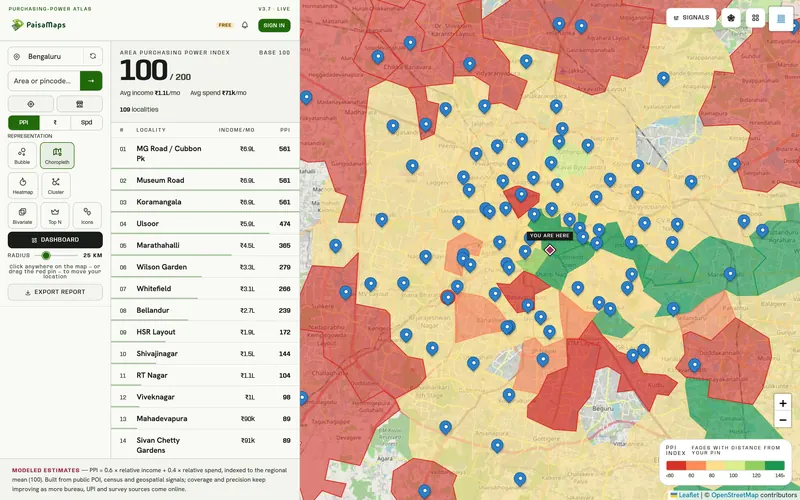
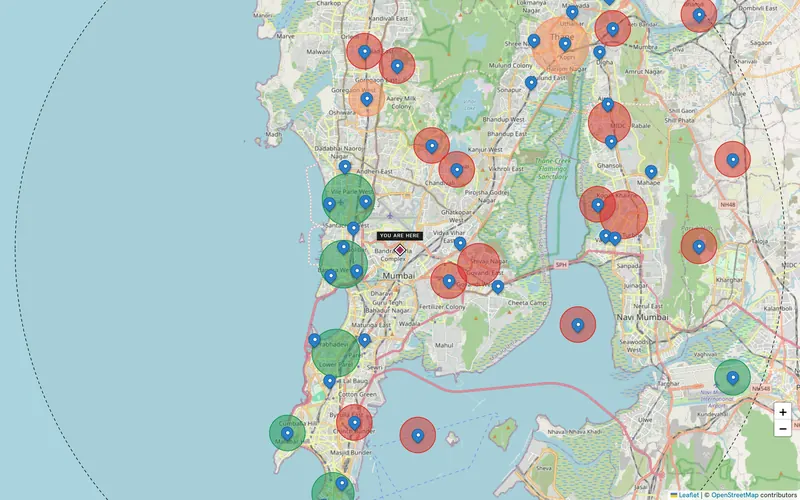
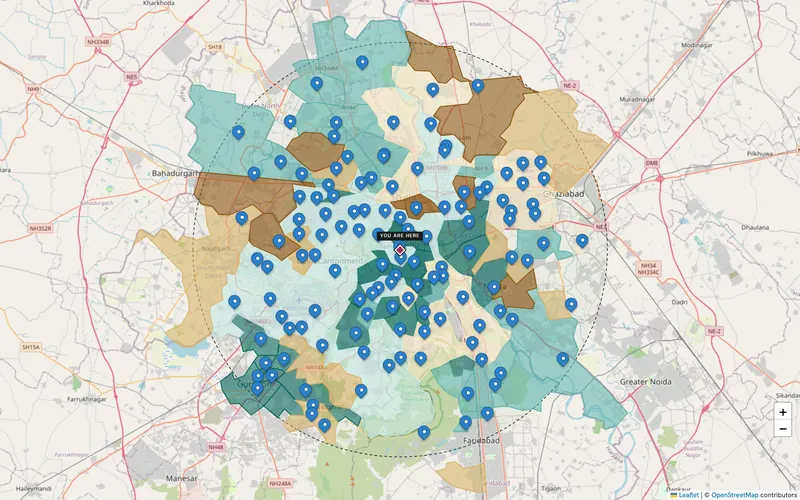
- Map itSee where that market sits, to plan the first stores.
The decision
The business case uses the filtered market and names the neighbourhoods for the first pilots.
What the team walks away with
- A market-size estimate with its method
- The pincode file behind it
- A map of where the market is
By industry
How each industry uses it
| Industry | What they do with it |
|---|---|
| Retail & F&B → | Sizes a new format or a new city before committing stores to it. |
| Real estate & hotels → | Sizes demand for a price band or a hotel segment in a city. |
| Lenders, NBFC & fintech → | Sizes a loan or payments product by region before launch. |
| Any business → | Counts the households that can afford the product in a target city. |
| Agencies & consultants → | Produces the bottom-up market size for a client's business case. |
Signals that matter here
Which signal answers which question
Every plan sees purchasing power, income and spend. These are the signal groups that move this decision.
| Signal group | What it tells you | The decision it feeds |
|---|---|---|
| Purchasing power | How much a typical household earns and spends, and how that ranks in its state | Where your price point has enough customers; which sites to shortlist |
| Tax & economy | How many people file income tax, and the local business base | Formal-income depth for lending; B2B and SME demand |
| Banking & UPI | How banked and how digitally active an area is | Where credit, payments or premium products will be adopted first |
| Vehicles | Car ownership, the car-to-two-wheeler mix, luxury and EV share | Premium vs value positioning; parking-led formats; mobility products |
Each signal's source and level (pincode, district or state) is listed on the signals page.
What you walk away with
A number with its working shown
You get
- Households and spend by pincode
- Segments by signal
- An export for your own model
You don't need
- A custom research study
- Survey fieldwork
- A data engineering project
Who does this
Industries that use it
Keep exploring
Where to go next
Lenders, NBFC & fintech
Banks, NBFCs, MFIs and fintechs use pincode income, spend and banking depth to prioritise sourcing, size products by region…
Explore →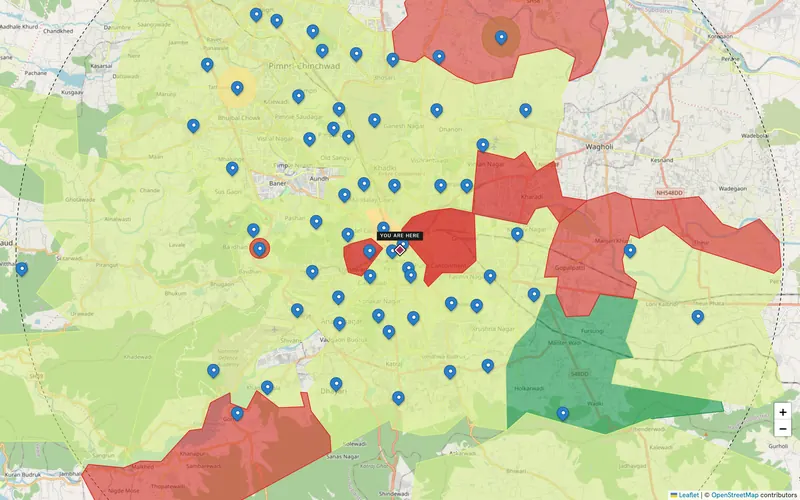
Any business
D2C brands, franchises, clinics, schools and SMEs use PaisaMaps to pick the next city, plan delivery zones and size a new…
Explore →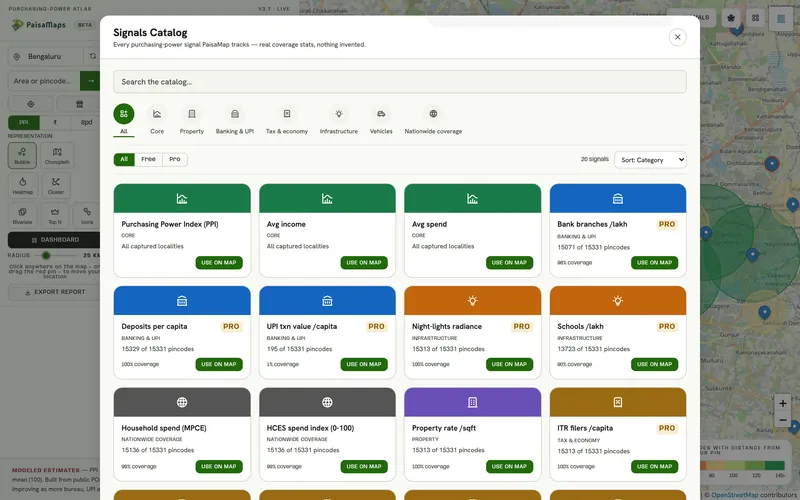
Data API & exports
Export purchasing power, income, spend and signals by pincode as CSV, Excel or JSON, or pull them with an API key. Higher…
Explore →