 PaisaMaps for business
Expansion forecast
Turn a budget into a ranked plan.
Tell us what you can invest. The forecast picks sites, estimates reachable revenue and payback, and shows every assumption.
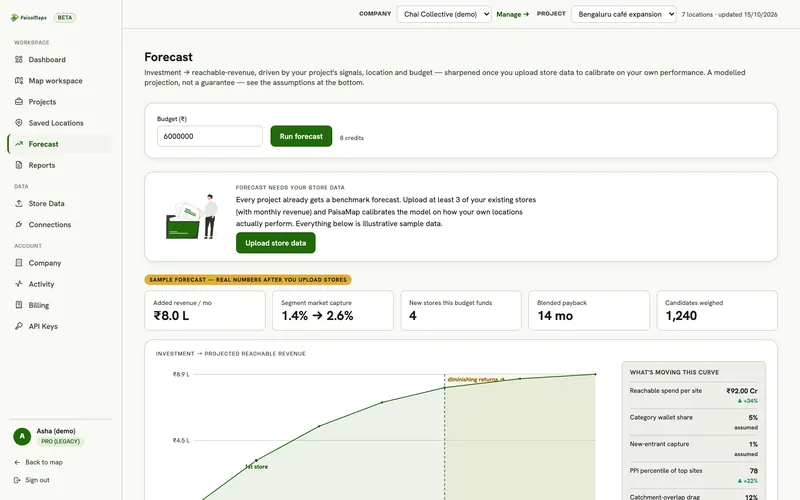
The curve
See where returns flatten
Investment against reachable revenue, with the point where each extra store adds less.
- Added revenue per month
- Stores the budget funds
- Blended payback
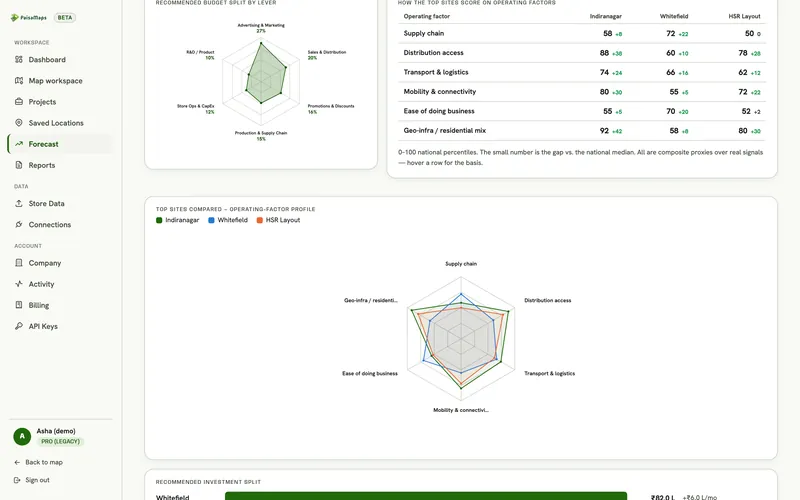
The sites
Why each site made the list
Top sites compared on operating factors (supply chain, distribution, transport, mobility, ease of business) and a recommended budget split.
- Radar of each site's profile
- Factor table with gaps to the national median
- Budget split by lever
How it works
Four steps, all visible
Budget
Your investment and how long you'll give each store.
Reach
Households and spend in each candidate's catchment, from the signals.
Capture
A share of that spend a new store can win, from benchmarks or your own stores.
Revenue range
Ranked sites with revenue and payback, labelled as estimates.
Know its limits
What the forecast is, and isn't
It is
- A ranked shortlist with a revenue range per site
- Every assumption on screen
- Calibrated to your stores once you upload three or more with revenue
It isn't
- A guarantee of revenue
- Built on footfall or transaction data
- Calibrated before you upload stores: until then it uses benchmark capture rates, and says so
Keep exploring
Where to go next
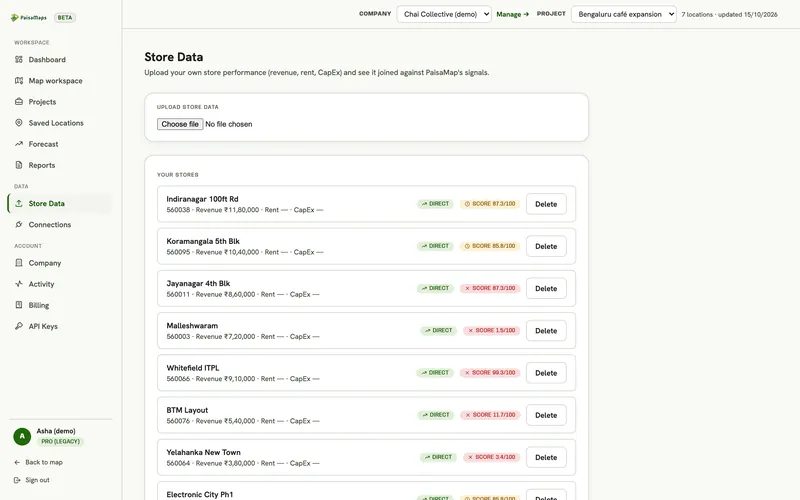
Portfolio benchmarking
Upload your stores or branches with revenue and see each one against its area, to find under- and over-performers and the…
Explore →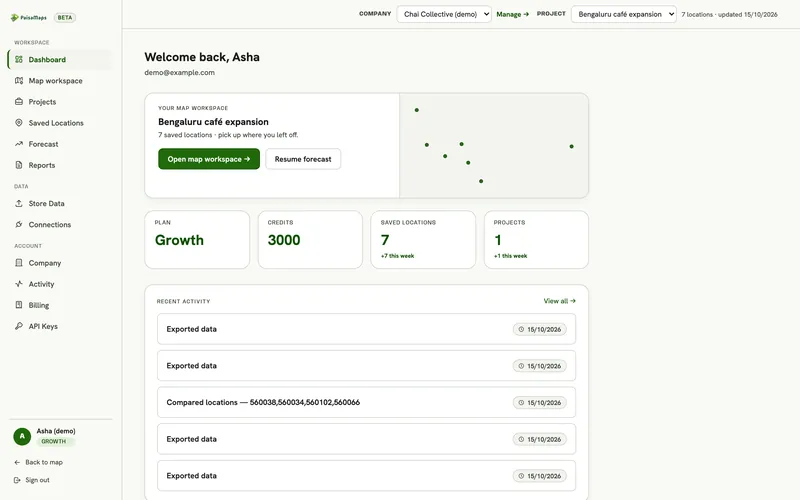
Workspace
A shared workspace for expansion decisions: projects, location intelligence, site comparison, saved-location pipeline, your…
Explore →
Retail & F&B
Retail, café, QSR and pharmacy chains use PaisaMaps to find pincodes that can support their ticket size, compare candidate…
Explore →Run the forecast on your next city
Tell us the cities and the decision you're making. We'll walk through it with you on the real data in about 20 minutes.