 PaisaMaps for business
Know what every pincode can spend before you open there.
Purchasing power, household income and spend for 15,341 Indian pincodes, scored from public data and refreshed weekly. See it on the map, then plan expansion in a workspace your team shares.
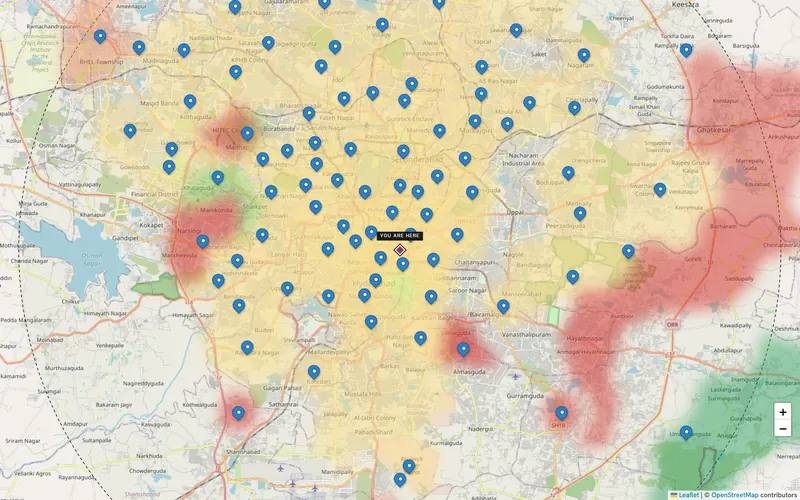
Built for the people who decide where
One map, five ways to use it
Start with the industry closest to yours. Each has its own page with the views and signals it uses most.
Lead use: site selection
Where does store #40 go?
Rank candidate pincodes by spending power, see the catchment around each site, and compare them side by side before you sign a lease.
- Purchasing power, income and spend for every pincode in a city
- Upload your own stores and see how each one's area scores
- A forecast that turns a budget into ranked sites and a revenue range
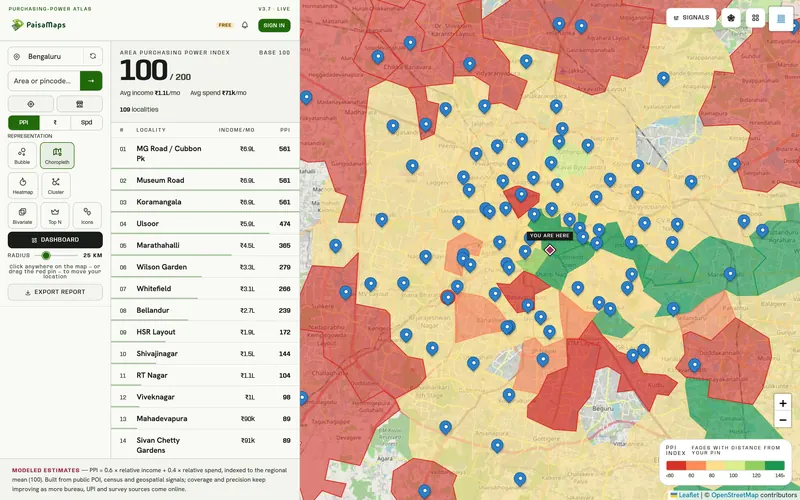
Catchment demand
Is there demand around this project?
Read the spending power of the pincodes around a project, a hotel site or a mall, and how it compares with the rest of the city.
- Heatmaps of income and spend across a city
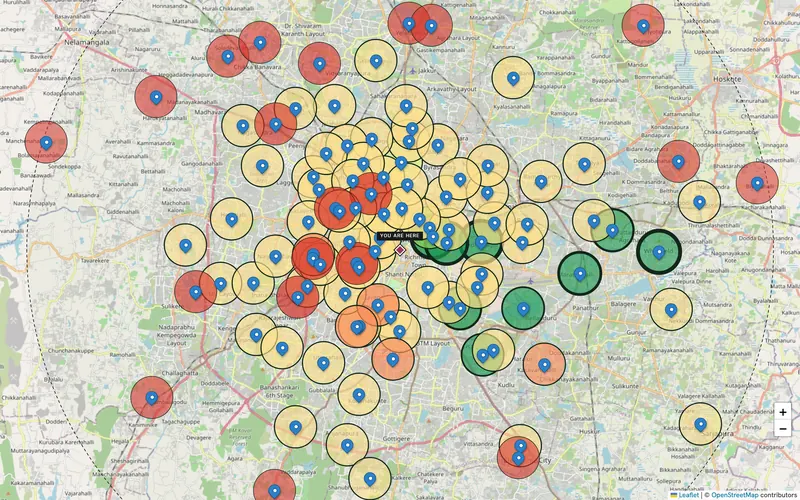
- Catchment rings at the radius you choose
- Shortlists you can share with investors and partners
Area affordability
How much can this area afford?
Use pincode-level income, spend and banking depth as an area input for sourcing, limits and market sizing, alongside your own bureau data.
- Banking branches, deposits and UPI value per head
- Bulk export by pincode for your models
- API keys with rate limits by plan
Know your market
Where are the customers who can afford you?
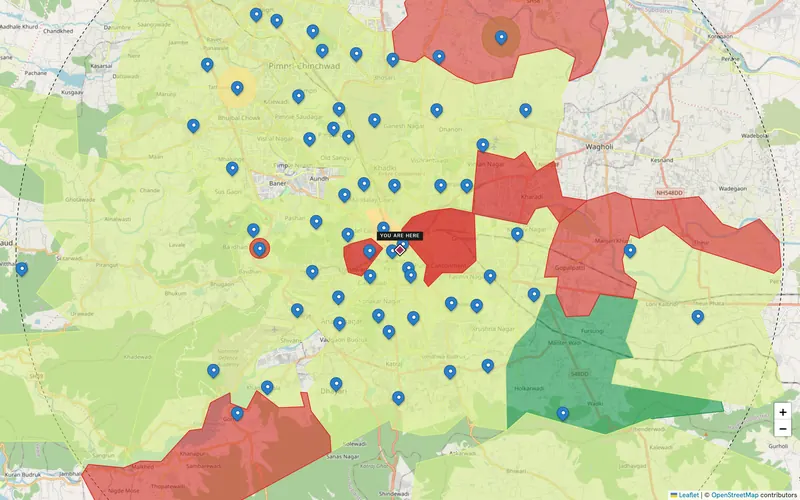
D2C brands, franchises and service businesses use the same map to pick cities, plan delivery zones and size a new market, without a GIS team.
- Free map, no sign-in needed
- Signals you can switch on one at a time
- Plans that start small and grow with you
For many clients
One account, every client
Strategy firms, agencies and consultants run each client as its own company, paid from one wallet, with usage reported per client.
- Separate companies per client, one bill
- Budgets and allowances per client and per person
- Exports and reports you can hand over
What you get
Everything to decide where, in one place
pincodes scored
That's 80% of India Post's 19,097 pincodes, and the number grows as people explore new areas.
core metrics + signals
Purchasing power, income and spend, plus banking, tax, vehicles, night-lights, UPI and more.
refresh
The model is refitted every week and checked against fixed sanity gates before it goes live.
Six ways to see the same city
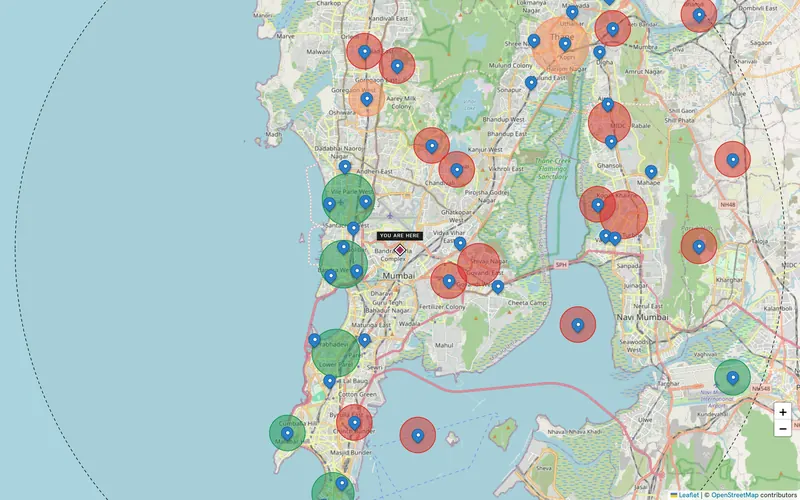
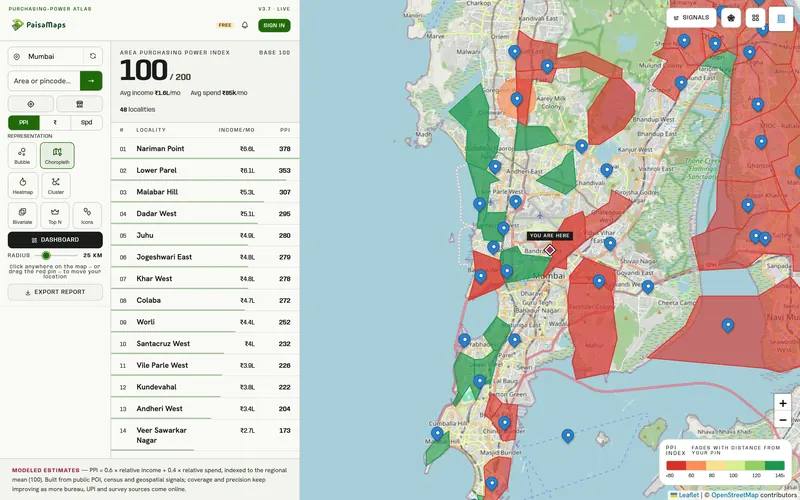
Bubbles, choropleth, heatmap, clusters, bivariate and top-N, so you can read a city however you think.
Your stores, scored
Upload a CSV or Excel file of your stores and see each one against its area.
Budget → sites
The forecast turns an investment budget into ranked sites with a revenue range.
Reports, exports and an API
PDF reports for the board, CSV/Excel/JSON exports for analysts, and API keys for your systems.
Read the same city two ways
Drag to compare income and spending power
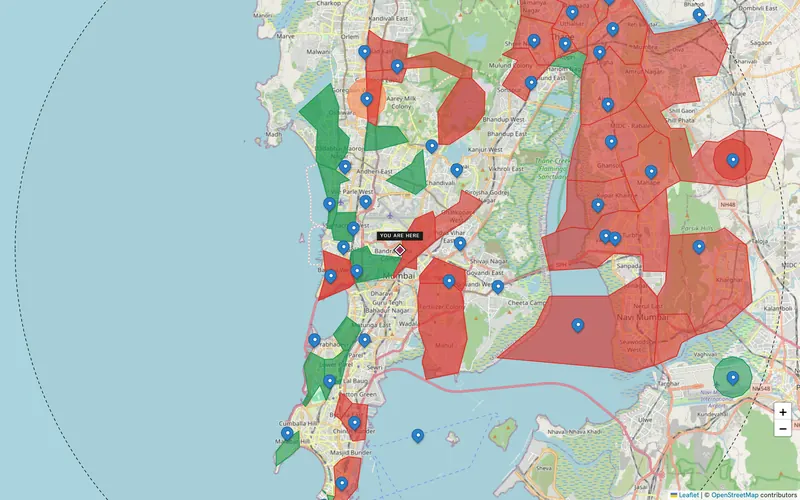
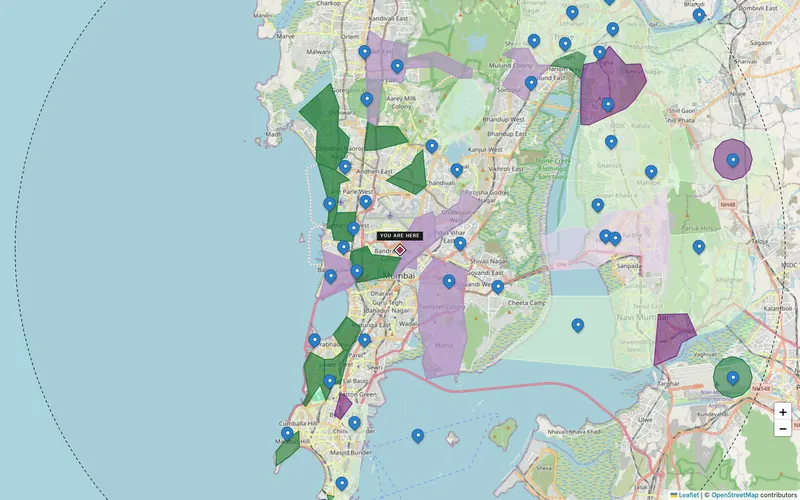
Every view is one click away on the map. Here's the same Mumbai view by estimated income and by purchasing power.
- Colours are ranked within the region, so local differences stand out
- Click any pincode for its numbers and signals
- Switch views without losing your place
The map
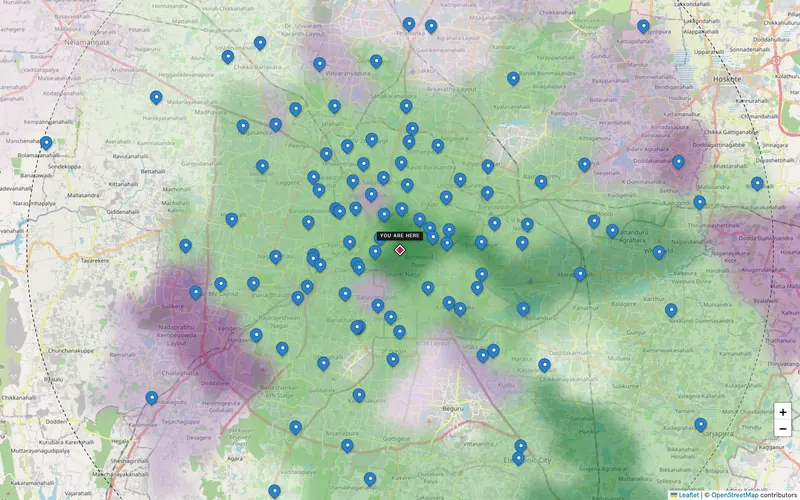
See a city the way your business needs
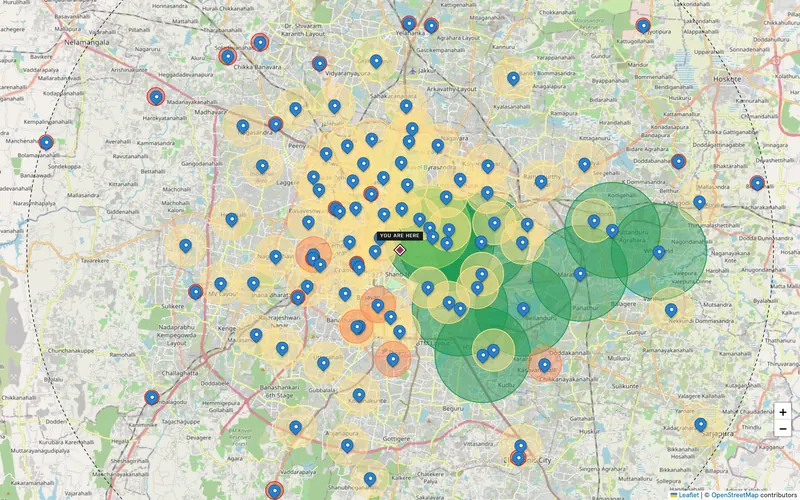
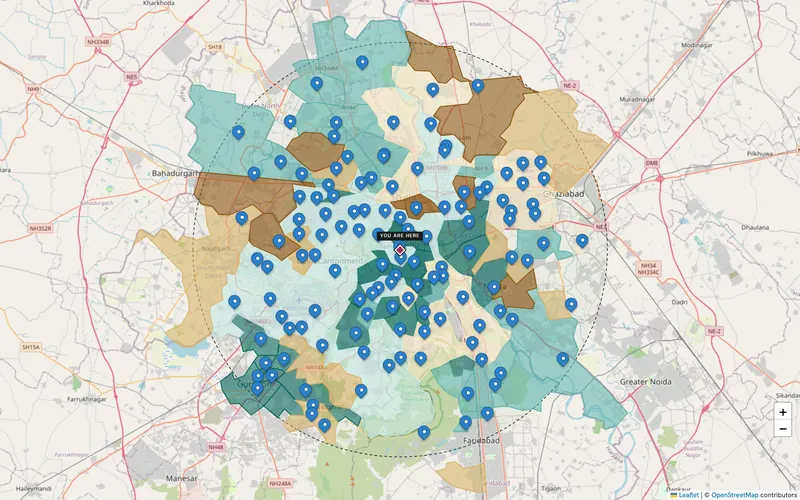
These are real screens from the live map, the same one anyone can open without signing in.
How it works
From a free look to a team workspace
Explore free
Open the map, search any city or pincode and read its purchasing power. No sign-in.
Sign in
Save locations and unlock more signals with a free account or a ₹200/month signal plan.
Plan in the workspace
Create a project, upload your stores, compare sites and run the forecast.
Share and decide
Invite your team, export the data and send a PDF report to whoever signs off.
Signal capturing
Built on public data you can trace
Scores are modelled estimates built from these sources, not measured household incomes. Each signal's source and refresh cadence is listed on the Signals & data page.
Pricing
Start free. Pay when it earns its keep.
All prices in rupees, before GST. The full table, credits and seat details are on the pricing page.
Free map
The map and three core metrics for every pincode.
- No sign-in needed
- Save locations with a free account
- Property rate (city-level estimate)
Signals Lite
9 more signals on the map.
- Banking, UPI, vehicles, tax
- Month to month
- Signals Pro ₹500 for all
Starter
The workspace for one company.
- 1,000 credits / month
- 3 seats
- Projects, compare, forecast, reports
Growth
More credits, more people, API access.
- 3,000 credits / month
- 6 seats
- Higher API limits
- Free viewers
Monthly prices shown. Annual plans save 20%. Scale and above are set up with our team.
FAQ
Questions buyers ask first
Where do the numbers come from?
From public sources: the national household spending survey, RBI banking data, income-tax filer counts, vehicle registrations, satellite night-lights, UPI value and more. We combine them into a purchasing-power score and income and spend estimates for each pincode. They are modelled estimates, not measured incomes.
How current is the data?
The model is refitted weekly and has to pass fixed sanity checks before anything changes on the map. Each source updates on its own schedule, which the Signals & data page lists.
Can I try it before paying?
Yes. The map is free without signing in. A free account lets you save locations, and we'll walk you through the workspace on your own cities before you choose a plan.
Can I use my own store data?
Yes. Upload a CSV or Excel file of your stores in the workspace; we geocode them and score each one against its area. Your data stays in your company's account and is encrypted at rest.
Do you have an API?
Yes. Any account can create an API key for pincode-level exports; Growth plans and above get higher rate limits.
Keep exploring
Where to go next
Retail & F&B
Retail, café, QSR and pharmacy chains use PaisaMaps to find pincodes that can support their ticket size, compare candidate…
Explore →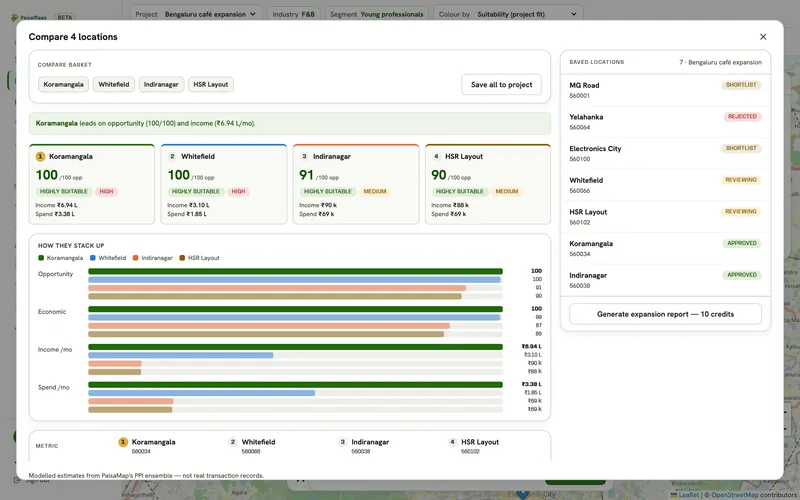
Platform overview
Location intelligence for India: a live pincode purchasing-power map, 15 economic signals, a team workspace for comparing…
Explore →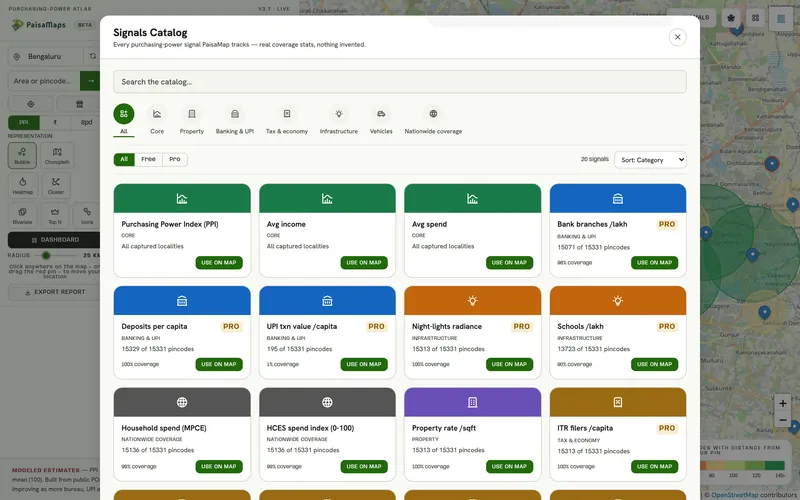
Methodology
How 15,341 pincode scores are built from public data, anchored to national household spending, checked every week and…
Read more →See your market on the map in a 20-minute call
Tell us the cities and the kind of site you're looking for, and we'll walk through them with you.