 PaisaMaps for business
Use case · Territory planning
Draw territories by spending power, not just area.
Give every rep or distributor a territory with a comparable market behind it, so targets are fair and coverage follows demand.
Why it matters
Territories drawn on area alone give one rep a goldmine and another a desert. Weight them by what households can spend and targets become fair.
Worked example
Rebalancing a distributor network
- ExportSpend and households for every pincode in the state.
- TotalSum per existing territory.
- Spot the gapsTwo territories carry far more spend than the rest.
- RedrawMove pincodes between neighbouring territories to even them out.
The decision
Territories are redrawn so each carries a comparable share of spend, and targets are reset to match.
What the team walks away with
- Spend totals per territory
- A rebalanced pincode assignment
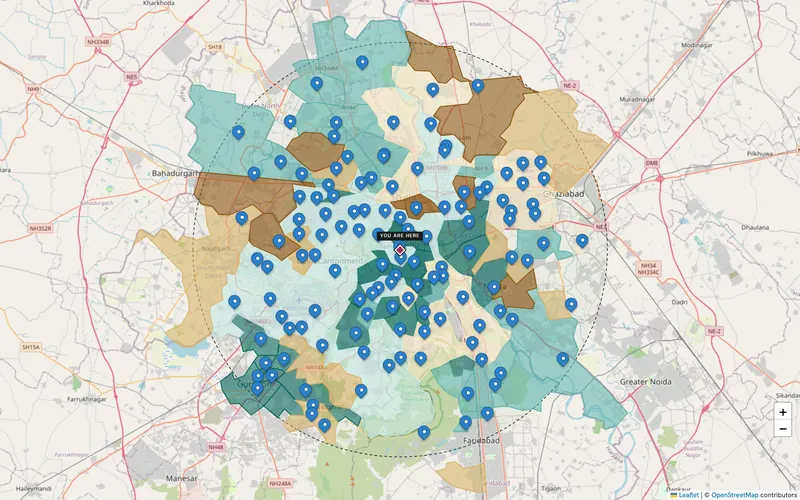
- A map of the new territories
How it's done
Balancing territories
See the spread
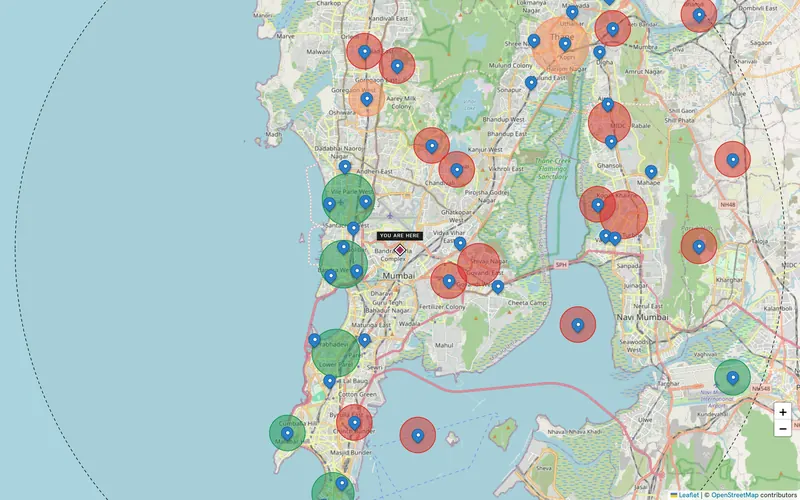
Clusters show where value groups together.
Export
All pincodes with purchasing power and spend.
Group
Assign pincodes to territories in your own tool.
Balance and revisit
Compare totals per territory; re-run as the data refreshes.
By industry
How each industry uses it
| Industry | What they do with it |
|---|---|
| Retail & F&B → | Balances distributor or area-manager territories by spend. |
| Lenders, NBFC & fintech → | Allocates sourcing teams and agents by market strength. |
| Any business → | Splits sales or delivery territories so each has a comparable market. |
What you walk away with
Territories with a fair market behind each
You get
- Spend and households per pincode
- Totals per territory
- A refreshable export
You don't need
- Territory-design software
- A consultant
- Survey data
Signals that matter here
Which signal answers which question
Every plan sees purchasing power, income and spend. These are the signal groups that move this decision.
| Signal group | What it tells you | The decision it feeds |
|---|---|---|
| Purchasing power | How much a typical household earns and spends, and how that ranks in its state | Where your price point has enough customers; which sites to shortlist |
| Vehicles | Car ownership, the car-to-two-wheeler mix, luxury and EV share | Premium vs value positioning; parking-led formats; mobility products |
Each signal's source and level (pincode, district or state) is listed on the signals page.
Keep exploring
Where to go next
Lenders, NBFC & fintech
Banks, NBFCs, MFIs and fintechs use pincode income, spend and banking depth to prioritise sourcing, size products by region…
Explore →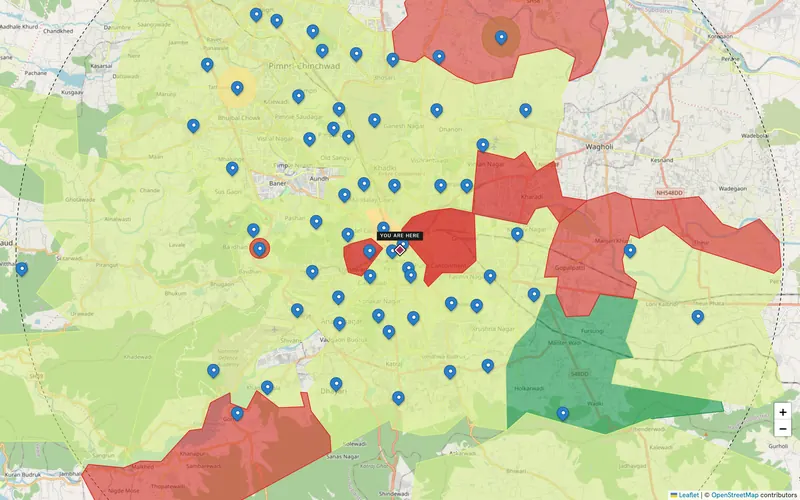
Any business
D2C brands, franchises, clinics, schools and SMEs use PaisaMaps to pick the next city, plan delivery zones and size a new…
Explore →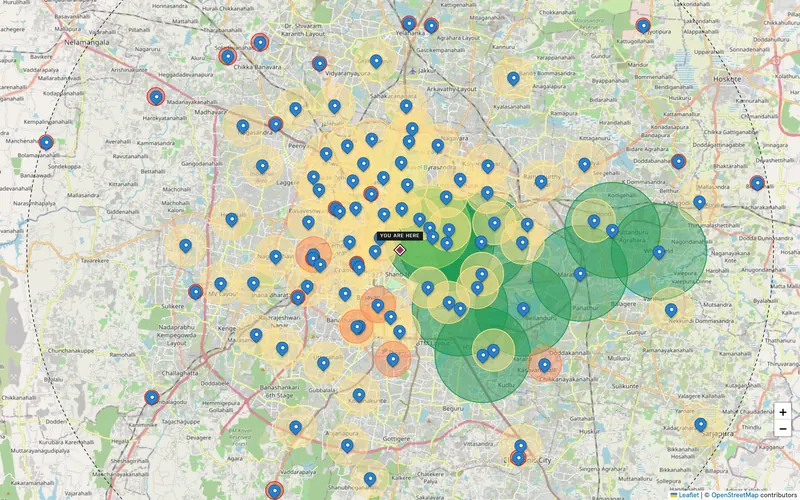
Live map
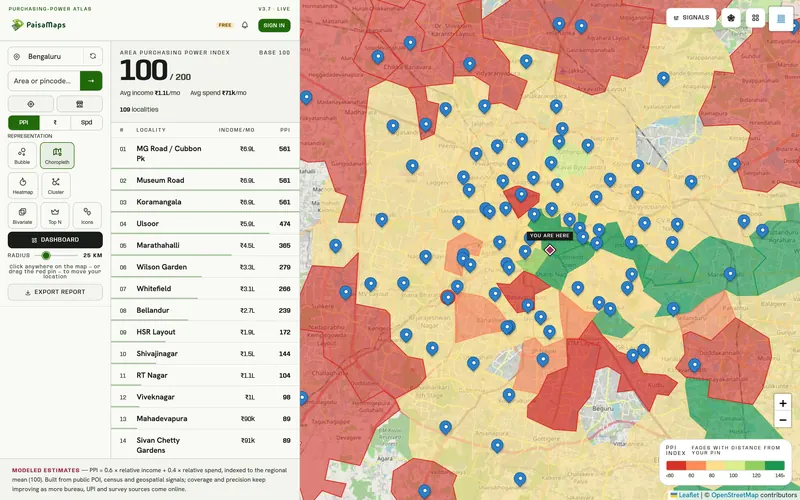
Search any Indian city or pincode and see purchasing power, income and spend as a choropleth, heatmap, bubbles, clusters…
Explore →