 PaisaMaps for business
The platform
From insight to a decision, in one place.
Every expansion, launch or sourcing plan starts with the same question: where can people afford what we sell? PaisaMaps answers it for every pincode, then carries the answer through to a ranked, costed decision.
- 15,341
- pincodes scored80% of India Post's 19,097
- 18
- signals3 core metrics + 15 on paid plans
- 769
- pincodes with data of their ownthe rest carry a labelled estimate
- Weekly
- model refitonly after fixed checks pass
What's inside
Six tools that work together
Live map
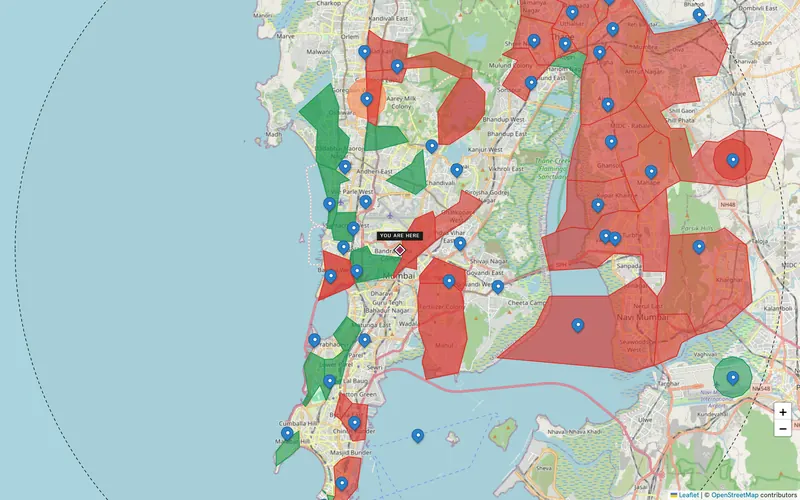
Every pincode's spending power
Search a city or pincode and read it six ways: choropleth, heatmap, bubbles, clusters, bivariate or top-N.
- Free, no sign-in
- Real India Post PIN boundaries
Signal palette
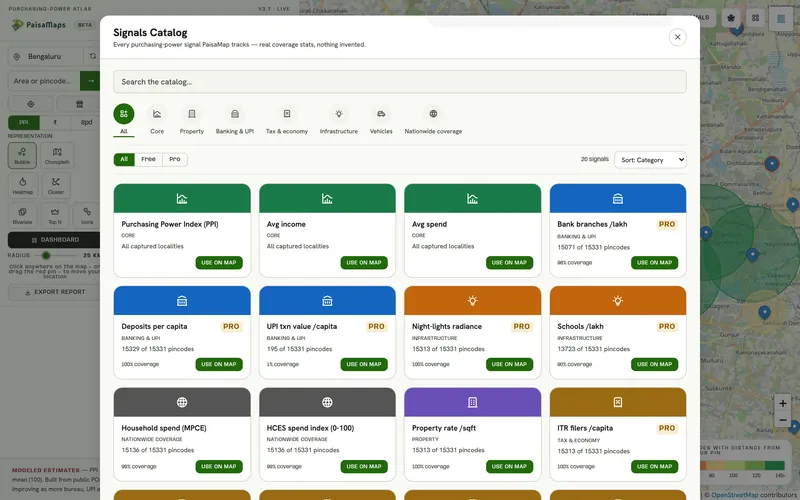
18 signals, each traced to a source
Banking, UPI, tax, vehicles, night-lights and more. Switch any of them on the map.
- Source and level on every signal
- Coverage shown per signal
Map workspace
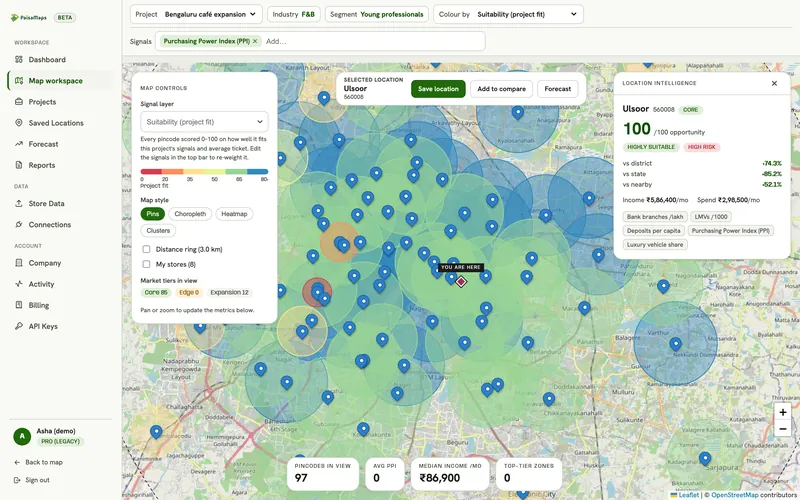
Click a pincode, get a verdict
Location intelligence for the pincode you pick: opportunity score, how it compares with the district and state, and the signals behind it.
- Distance rings
- Your own stores on the map
Compare
Shortlists you can defend
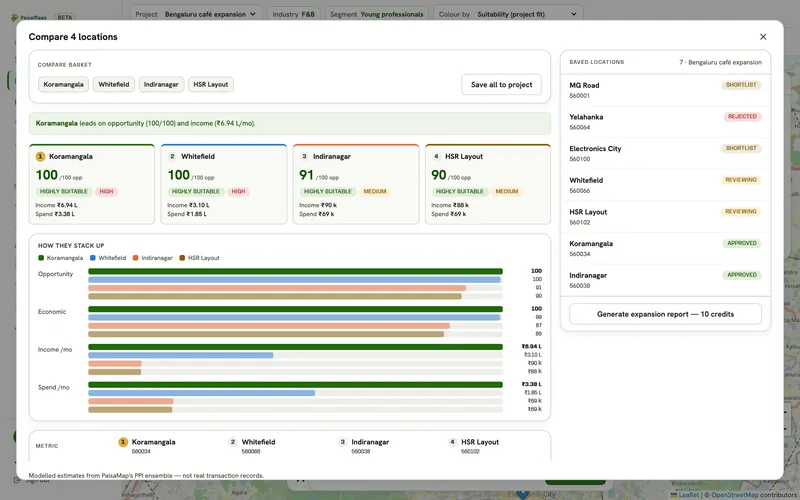
Line up the candidates and see which leads on opportunity, income and spend, and by how much.
- Up to five sites
- Save the shortlist in one click
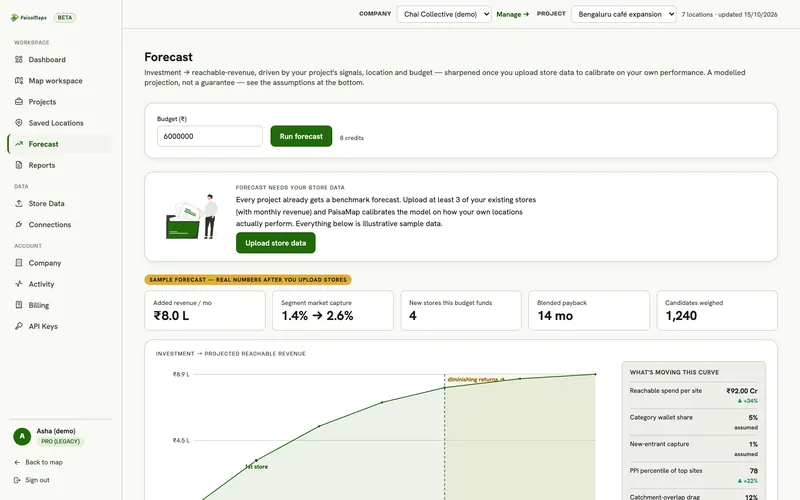
Forecast
A budget becomes a plan
Enter what you can invest and get ranked sites, reachable revenue and payback, with every assumption shown.
- Labelled as estimates
- Calibrates to your stores
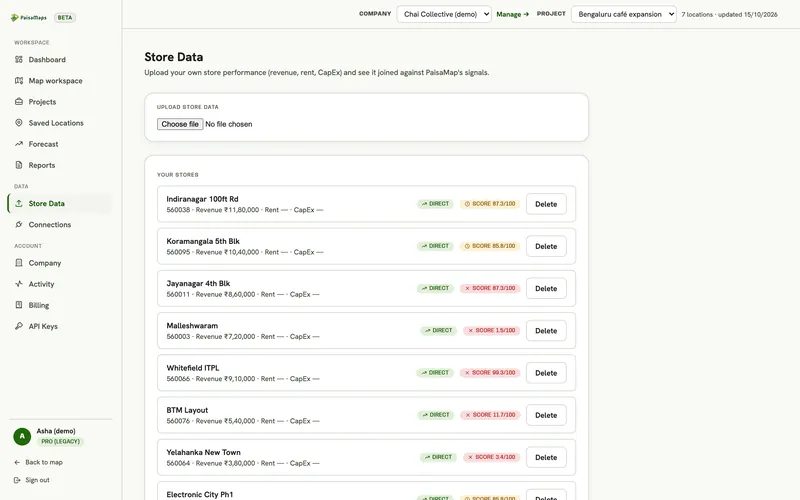
Your data
Your stores, scored
Upload a CSV or Excel file of your stores with revenue. Each one is scored against its area, and the forecast learns from them.
- Encrypted at rest
- Delete an upload any time
Why teams use it
Insight, comparison, decision
See it
Purchasing power, income, spend and 15 signals for every pincode, on a map you can read in seconds.
Weigh it
Put up to five sites side by side: scores, income, spend and how they rank.
Commit to it
Turn a budget into ranked sites and a revenue range, then send a report to whoever signs off.
Grounded in your own stores
Upload your store list and see which signals your best stores share. New sites are scored against that.
Labelled honestly
Modelled numbers say so. Property rate is marked as a city-level estimate.
Checked every week
The model is refitted weekly and must pass fixed sanity checks before the map changes.
Signals that matter here
18 signals, read as business questions
Every plan sees purchasing power, income and spend. These are the signal groups that move this decision.
| Signal group | What it tells you | The decision it feeds |
|---|---|---|
| Purchasing power | How much a typical household earns and spends, and how that ranks in its state | Where your price point has enough customers; which sites to shortlist |
| Banking & UPI | How banked and how digitally active an area is | Where credit, payments or premium products will be adopted first |
| Tax & economy | How many people file income tax, and the local business base | Formal-income depth for lending; B2B and SME demand |
| Infrastructure | Night-time activity and schooling, as a read on how developed an area is | Whether a catchment is established or still emerging |
| Vehicles | Car ownership, the car-to-two-wheeler mix, luxury and EV share | Premium vs value positioning; parking-led formats; mobility products |
| Property | A city-level estimate of property rates | Rent and capex context for a city (not a valuation) |
Each signal's source and level (pincode, district or state) is listed on the signals page.
Keep exploring
Where to go next
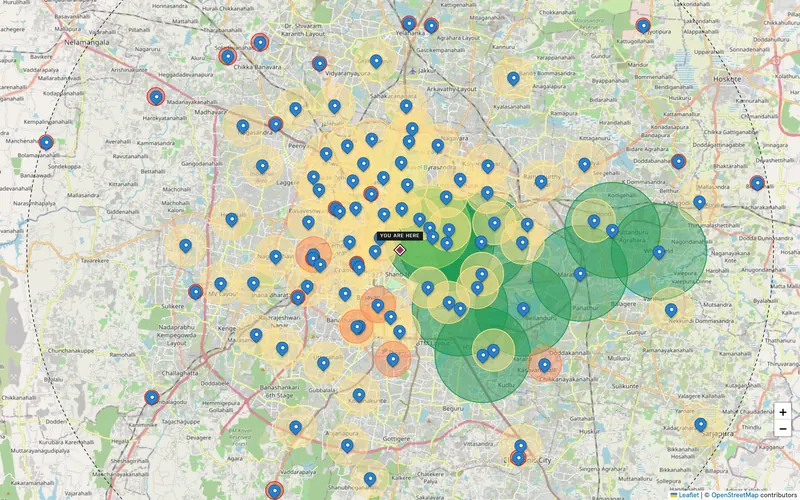
Live map
Search any Indian city or pincode and see purchasing power, income and spend as a choropleth, heatmap, bubbles, clusters…
Explore →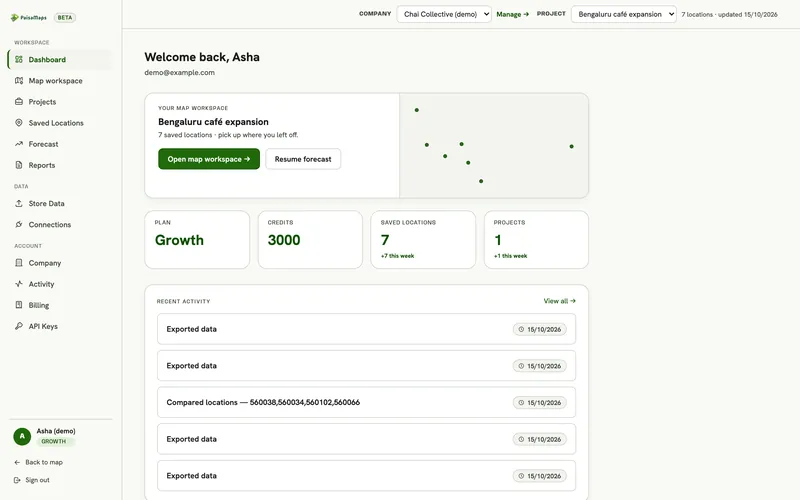
Workspace
A shared workspace for expansion decisions: projects, location intelligence, site comparison, saved-location pipeline, your…
Explore →Signals & data
Pincode-level economic data for India: purchasing power, income, spend and 15 signals across banking, tax, infrastructure…
Explore →See your own market on the map
Tell us the cities and the decision you're making. We'll walk through it with you on the real data in about 20 minutes.