 PaisaMaps for business
ObjectiveMatch the product to the catchment
With PaisaMapsRead estimated household income and spend for every pincode within the radius you choose.
OutcomeUnit sizes, price bands and tenant mix pitched at the households who live there.
For developers, mall operators and hotel chains
Land, pricing and tenant mix are decided years before the first customer arrives. PaisaMaps shows what the households around a plot can afford today, so the project is pitched at the market that's really there.
What you can achieve
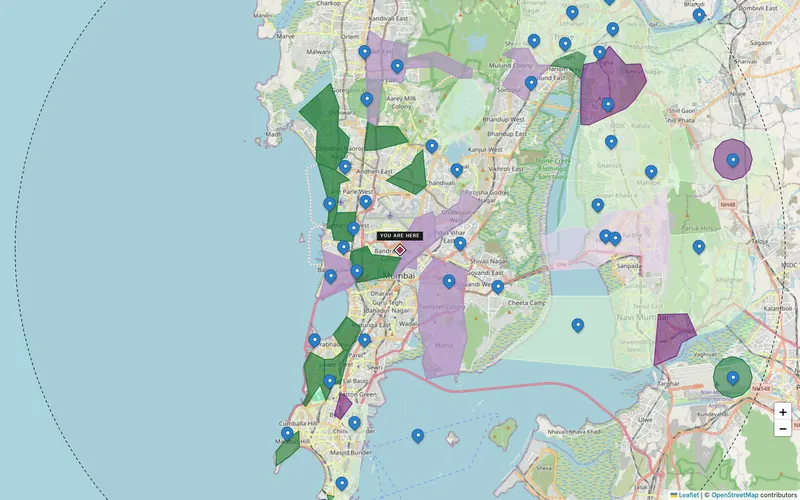
ObjectiveMatch the product to the catchment
With PaisaMapsRead estimated household income and spend for every pincode within the radius you choose.
OutcomeUnit sizes, price bands and tenant mix pitched at the households who live there.
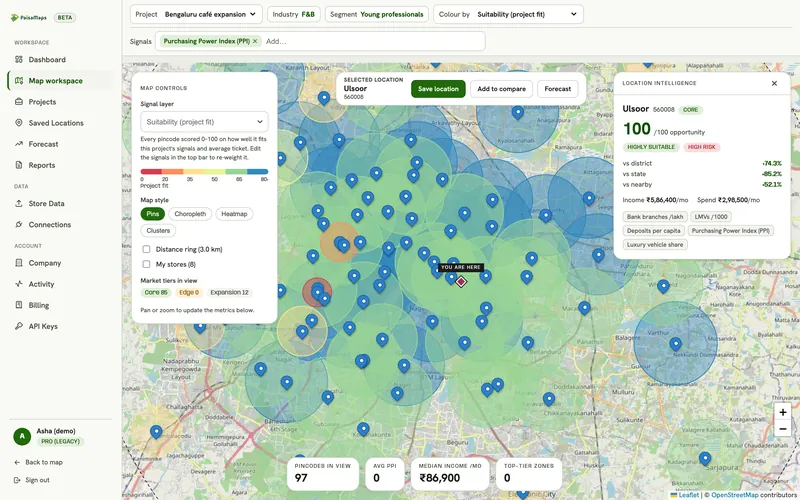
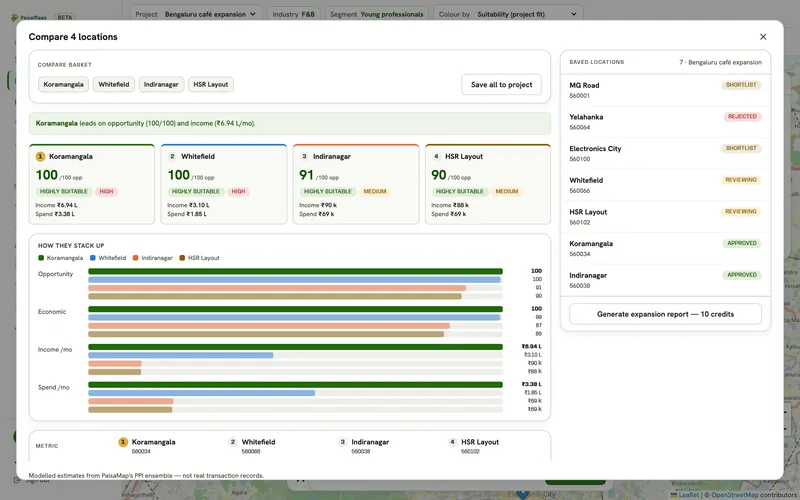
ObjectiveChoose between candidate plots
With PaisaMapsCompare plots side by side on purchasing power, income and spend of their catchments.
OutcomeA ranked plot list with the reasons written down.
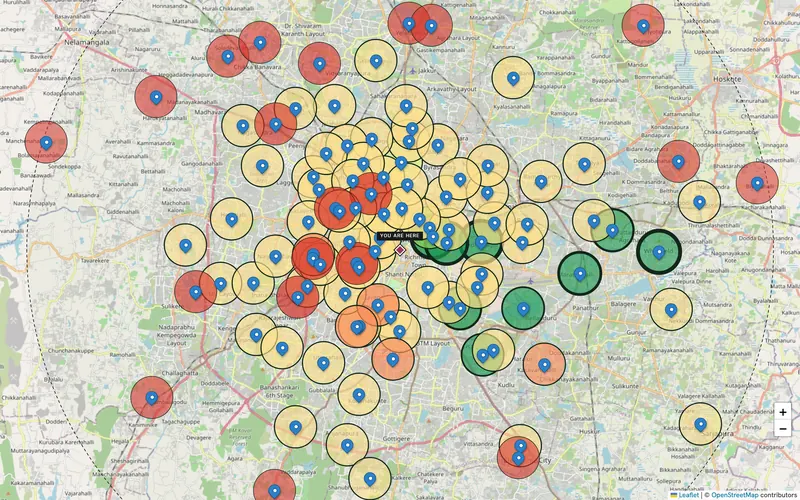
ObjectivePitch tenants with evidence
With PaisaMapsShow retailers and F&B brands the spending power around your mall, pincode by pincode.
OutcomeLeasing conversations that start with their customers, not your floor plan.
ObjectiveGive investors a case they can check
With PaisaMapsKeep plots, notes and reports in one project; share a PDF or read-only link.
OutcomeA demand story that survives due diligence.
ObjectivePlace a hotel where its guests spend
With PaisaMapsRead the affluence and vehicle ownership of the surrounding area.
OutcomeA clearer view of local demand for F&B, banqueting and business stays.
Who's involved
Uses it every week
Reads catchments around plots and malls, builds comparisons and tenant pitches.
What they getA catchment readout for any plot in minutes.
Reads and decides
Reviews the demand case before committing land, pricing or a brand.
What they getEvidence that holds up with investors and partners.
Pays for it
Funds feasibility work across the project pipeline.
What they getProjects pitched at the market that's actually there.
The principle
A catchment is households and what they can spend, not hectares inside a ring.
A business case, start to finish
The plot with the smaller but more affluent catchment goes forward; the other is parked for a value-segment project.
Signals that matter here
Every plan sees purchasing power, income and spend. These are the signal groups that move this decision.
| Signal group | What it tells you | The decision it feeds |
|---|---|---|
| Purchasing power | How much a typical household earns and spends, and how that ranks in its state | Where your price point has enough customers; which sites to shortlist |
| Vehicles | Car ownership, the car-to-two-wheeler mix, luxury and EV share | Premium vs value positioning; parking-led formats; mobility products |
| Infrastructure | Night-time activity and schooling, as a read on how developed an area is | Whether a catchment is established or still emerging |
| Property | A city-level estimate of property rates | Rent and capex context for a city (not a valuation) |
Each signal's source and level (pincode, district or state) is listed on the signals page.
Getting started
No integration project. Most teams are reading their own cities on day one.
Open the free map and read the area around the plot.
We set up your workspace; add the candidate plots.
Rings, comparisons and notes in one place.
Send the report, or add investors as free viewers.
Use cases
| Use case | How real estate & hotels teams use it |
|---|---|
| Site selection → | Chooses between plots and mall units on the strength of their catchments. |
| Market sizing → | Sizes demand for a price band or a hotel segment in a city. |
| Catchment analysis → | Reads the households around a project to set unit mix, pricing or tenant mix. |
Before you buy
No. It's a city-level estimate, labelled as such, and free on every plan. Use it as context, not as a valuation.
Yes, for reading the spending power of the surrounding area. It doesn't include tourism, occupancy or travel data.
Yes. Generate a PDF report or a read-only project link, or add partners as free viewers.
Keep exploring
Draw a ring around a site and read the purchasing power, income, spend and signals of every pincode inside it, compared with…
Explore →Shortlist candidate pincodes by purchasing power, check each catchment, compare up to five sites side by side and send a…
Explore →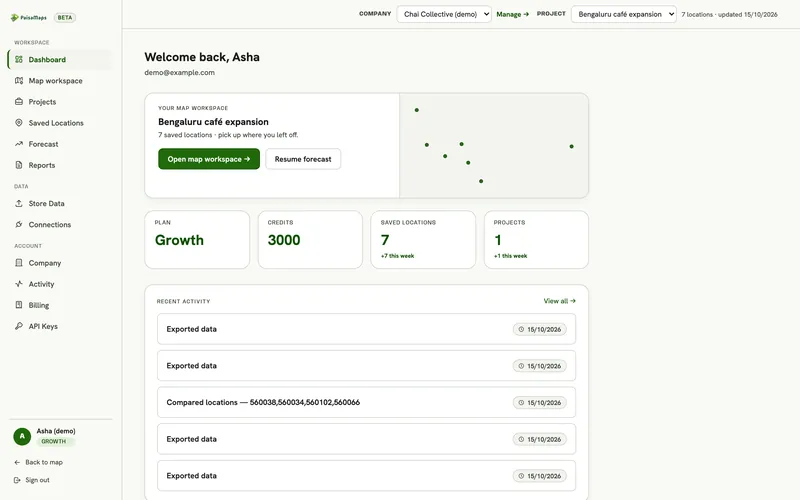
A shared workspace for expansion decisions: projects, location intelligence, site comparison, saved-location pipeline, your…
Explore →Share a location and your target price band; we'll read its catchment with you.