 PaisaMaps for business
ObjectivePlace a showroom or workshop
With PaisaMapsRank pincodes by income and car ownership, and check distance to the dealers you already have.
OutcomeNew outlets where buyers live, not where the last vacancy was.
For OEMs, dealer groups and vehicle financiers
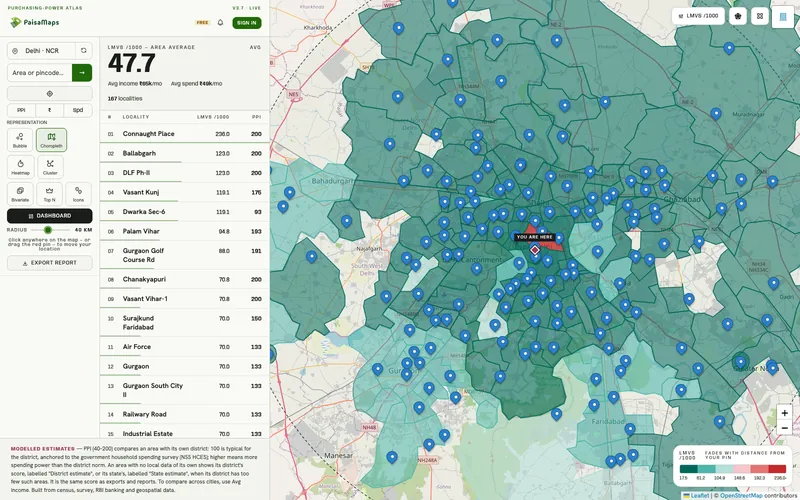
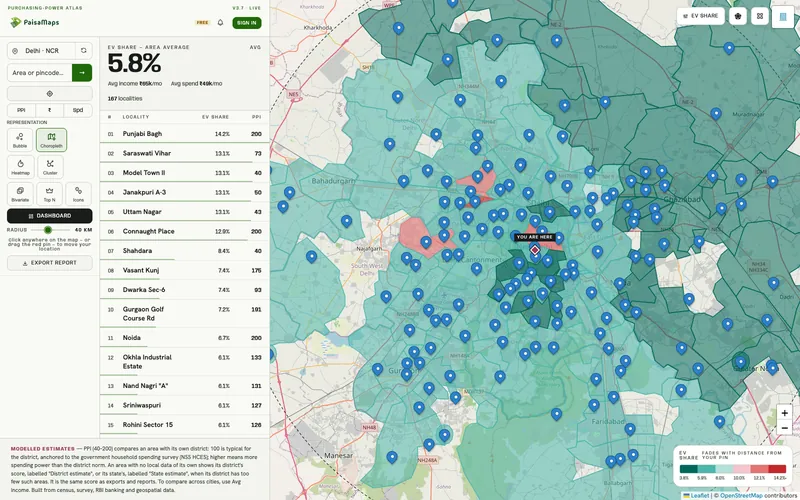
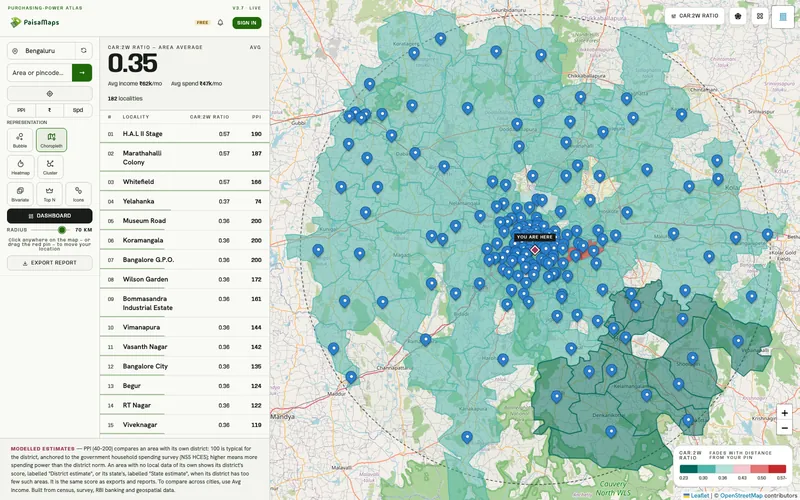
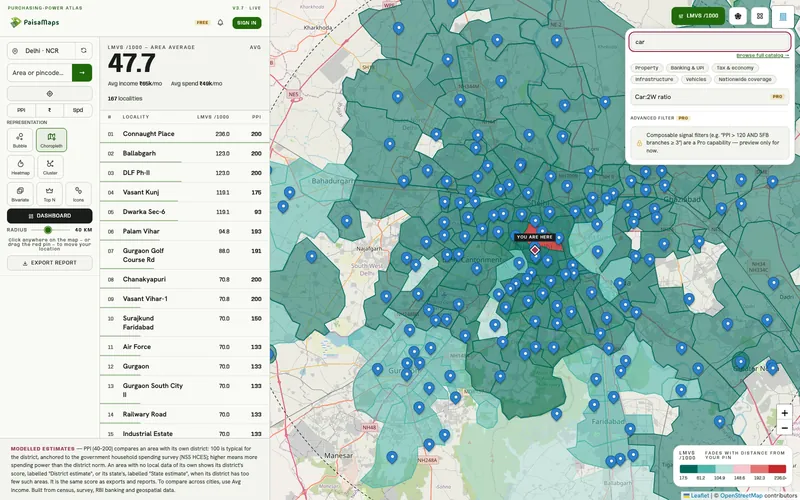
Car ownership, the car-to-two-wheeler mix, luxury and EV share, read next to what households earn and spend. Dealer networks use it to place showrooms and workshops; financiers use it to point sourcing at areas that can afford the ticket.
The vehicle signals
Vehicle signals come from VAHAN registrations at district level; income and spend are pincode-level estimates. Read together, they show where a market is ready for its next vehicle.
What you can achieve
ObjectivePlace a showroom or workshop
With PaisaMapsRank pincodes by income and car ownership, and check distance to the dealers you already have.
OutcomeNew outlets where buyers live, not where the last vacancy was.
ObjectivePick the format for each area
With PaisaMapsRead luxury share and the car-to-two-wheeler mix next to purchasing power.
OutcomePremium, volume or two-wheeler formats matched to the market.
ObjectivePlan an EV roll-out
With PaisaMapsFind districts where EV share is already ahead and households have the income to follow.
OutcomeEV showrooms and charging partners placed where early buyers are.
ObjectivePoint vehicle-loan sourcing
With PaisaMapsLook for areas whose households can afford a step up while the mix is still two-wheeler-led.
OutcomeDealer tie-ups and field teams aimed at first-car and upgrade buyers.
On the live map
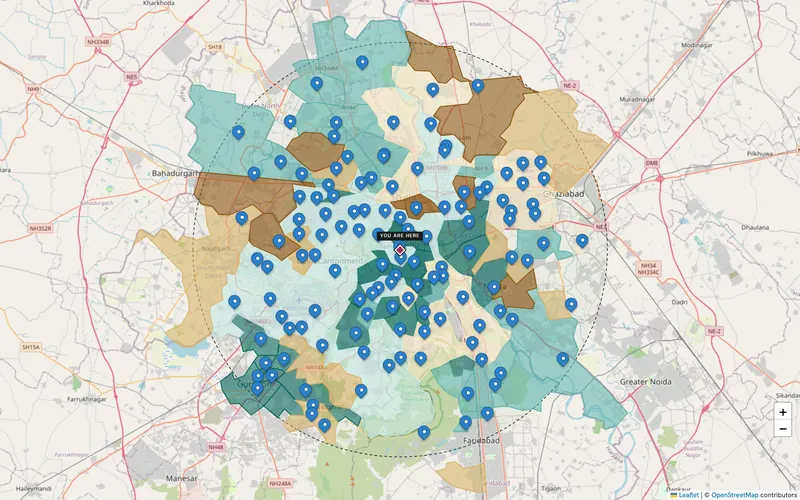
Car ownership across Delhi NCR, with the signal explorer open.
A business case, start to finish
The launch starts with dealers in the highest-ranked areas, and the area signals go into the financier's own sourcing model, reviewed under its credit policy.
Who's involved
Uses it every week
Reads vehicle signals by region, places candidate outlets, uploads dealer volumes, exports areas for sourcing.
What they getA ranked list of areas for outlets and loan campaigns, in an afternoon.
Reads and decides
Signs off new outlets, formats and the regions a finance product launches in.
What they getShowroom and launch decisions backed by the same evidence.
Pays for it
Funds network planning or distribution analytics.
What they getOutlets and loan sourcing that follow buyers, not vacancies.
Signals that matter here
Every plan sees purchasing power, income and spend. These are the signal groups that move this decision.
| Signal group | What it tells you | The decision it feeds |
|---|---|---|
| Vehicles | Car ownership, the car-to-two-wheeler mix, luxury and EV share | Premium vs value positioning; parking-led formats; mobility products |
| Purchasing power | How much a typical household earns and spends, and how that ranks in its state | Where your price point has enough customers; which sites to shortlist |
| Banking & UPI | How banked and how digitally active an area is | Where credit, payments or premium products will be adopted first |
Each signal's source and level (pincode, district or state) is listed on the signals page.
Getting started
No integration project. Most teams are reading their own cities on day one.
Switch on the vehicle signals for your regions on the map.
We set up the workspace and rank one region with you.
Upload dealers or branches with their volumes; see each against its area.
Export or pull by API for every region you plan.
Before you buy
No. We use district-level VAHAN aggregates: car ownership, the car-to-two-wheeler ratio, luxury share and EV share. Brand and model data isn't included.
Yes. Upload a CSV or Excel file with dealer, pincode and a performance figure; each dealer is scored against its area.
No. It updates when we refresh the source, not in real time.
No. Every signal is area-level and the same for everyone in it. It's for where to source and how to size, alongside your own credit data.
Keep exploring
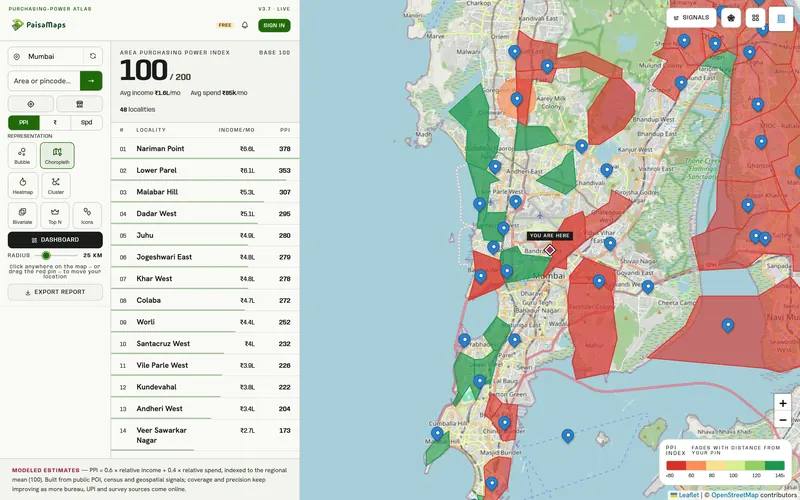
Shortlist candidate pincodes by purchasing power, check each catchment, compare up to five sites side by side and send a…
Explore →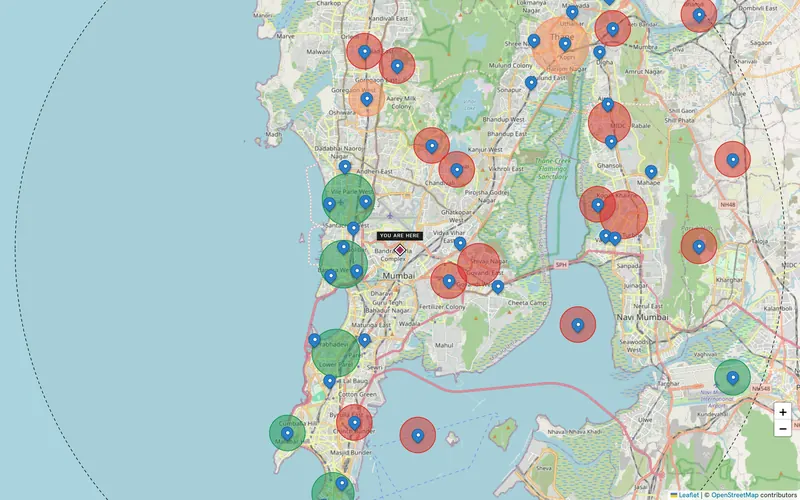
Balance sales, distribution and delivery territories so each has a comparable market behind it, using pincode purchasing…
Explore →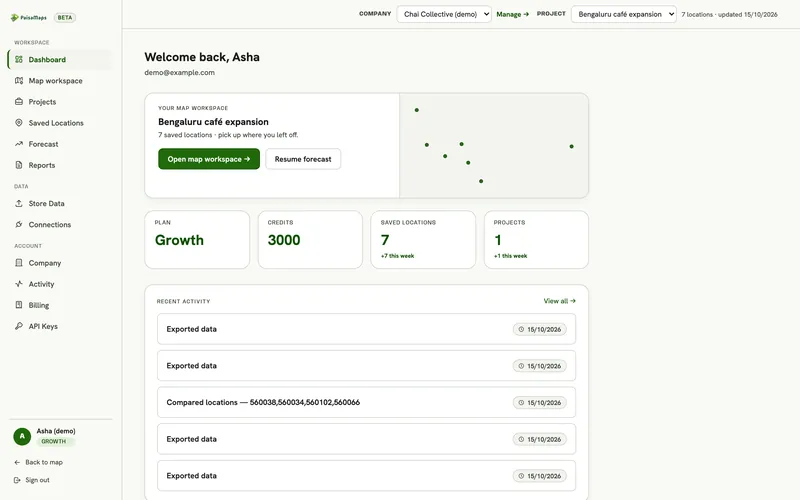
A shared workspace for expansion decisions: projects, location intelligence, site comparison, saved-location pipeline, your…
Explore →We'll show you car ownership, EV share and spending power there, and where your dealers sit.